


Introduction
Need to showcase what your team has accomplished in the year? A focused presentation delivery turns scattered wins, priorities, and performance signals into a clear narrative that highlights how the team's work advanced the organization. Our Team Year in Review deck includes slides that quantify results, spotlight initiatives, clarify operational shifts, acknowledge talent developments, and set a forward plan. When approached with intent, a year-in-review sharpens internal credibility, strengthens cross-team understanding, and creates shared vision on the capabilities and momentum the team will carry into the next cycle.
Organizations that institutionalize this level of reflection gain clearer strategic prioritization, more disciplined resource planning, and stronger confidence from stakeholders. Outcome reviews at a team level turns hindsight into actionable foresight that enables organizations to direct investment toward proven value drivers and position themselves for faster, more coordinated execution in the year ahead.
Context
Equip stakeholders with the situational context they need before evaluating any performance metrics or project outcomes. Within that frame, the Business Environment Impact view clarifies the external forces that shaped the team's operating reality. Rather than relying on retrospective narrative alone, this snapshot distinguishes between headwinds, neutral conditions, and tailwinds, which helps leadership understand not only what the team delivered but also the level of difficulty behind those achievements.
Many teams feel pressure from macroeconomic shifts, unpredictable supply chains, regulatory noise, and the rapid rise of automation and AI tools. A neutral summary of these dynamics gives decision-makers a shared reference point, which reduces debate about assumptions and refocuses attention on the implications for execution and resourcing.
Team Performance
It's now time to shift the discussion to the core section of this presentation. A Milestones Achieved layout is a strong entry point. Quarterly markers help leaders understand not only what happened but also when momentum accelerated or slowed. By tying each milestone to a capability theme such as efficiency or agility, the view creates a coherent narrative about how the team strengthened its operating model across the year.
Team Objectives and Key Results connect ambition to quantifiable movement. The OKR view brings rigor to a year-in-review as it eliminates ambiguity and focuses attention on where the team advanced outcomes that matter to customers, operations, or the business overall.
A more macro view like the Performance Trend chart adds temporal depth. Results displayed quarter by quarter highlight whether improvements were sustained, episodic, or driven by specific initiatives. These patterns help diagnose what truly worked across the year and inform decisions about where to double down or reset. A cumulative perspective also builds credibility because it demonstrates consistency, not isolated wins.
Budget Utilization completes the picture by pairing financial stewardship with value creation. Many teams spend heavily yet struggle to demonstrate proportional returns. A utilization and ROI view links investment to output. That linkage is essential for justifying future budgets and reinforcing the discipline expected in high-performing teams.
Projects and Initiatives
The projects and initiatives section connects day-to-day execution with the broader value narrative. It gives stakeholders a clear view of where effort went, what moved forward, and how those choices advanced strategic priorities. The Project Portfolio pipeline lays out initiatives across progress stages. This view helps audiences assess whether the team managed a balanced mix of foundational work, modernization, and forward investment.

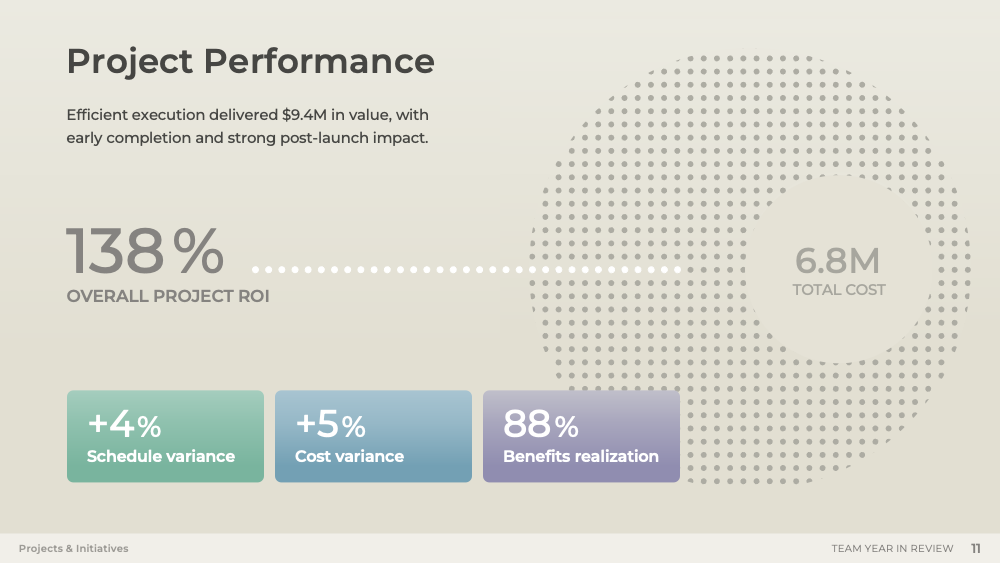
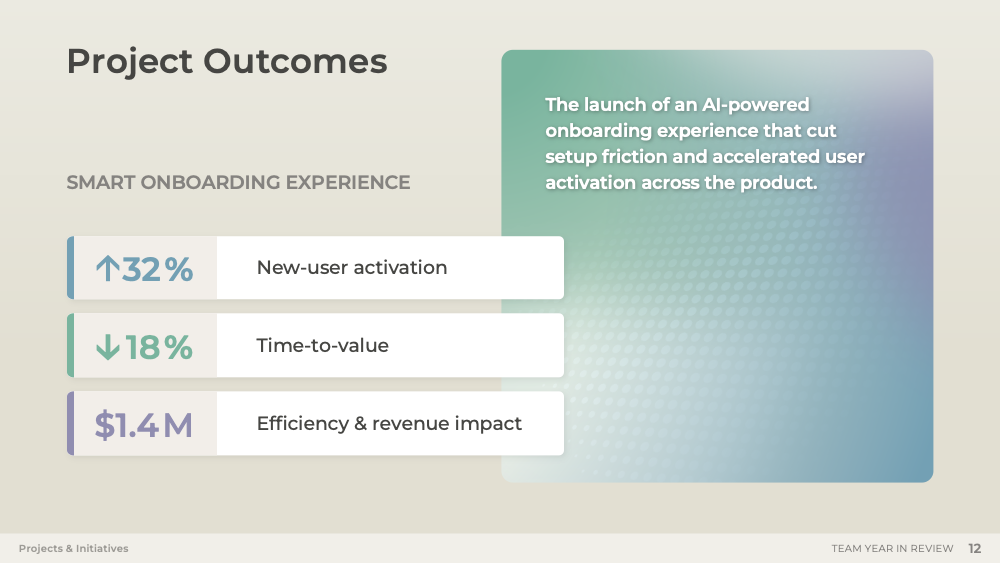
Where the portfolio view gives breadth, the combination of Project Performance and Project Outcomes provides depth. Project Performance consolidates the cumulative results of the year's investments with a high-level picture of how efficiently the team deployed resources and how much value those efforts generated. Project Outcomes complements that with a focused spotlight on a single project, almost like a compact case study. Highlighting one initiative in detail demonstrates what strong execution looks like in practice and gives the audience a tangible example of value creation.
Process
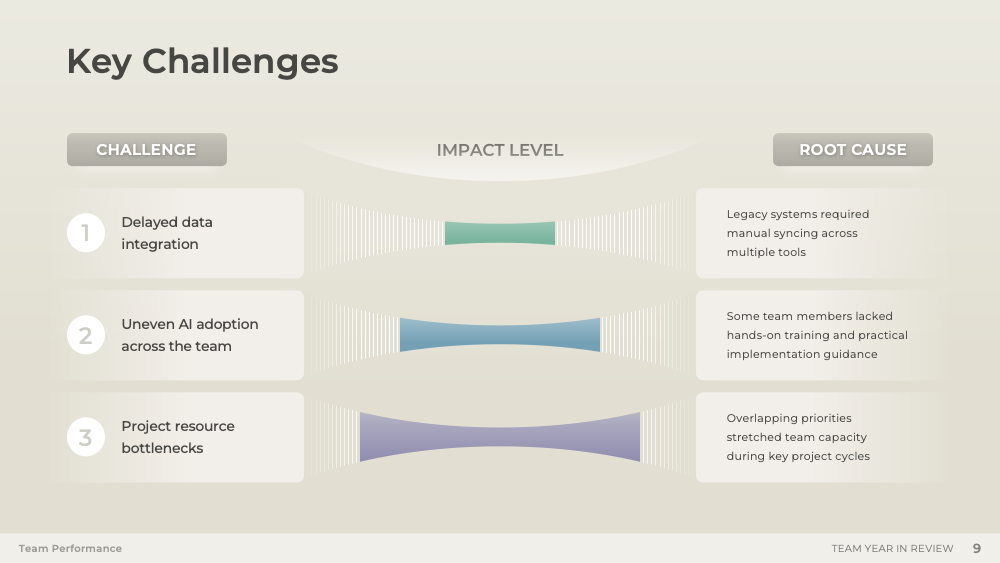
After the performance and project narratives, discussions about team process show whether underlying systems, workflows, and tools became more stable, more efficient, and more capable of supporting scaled delivery. Team Utilization connects labor effectiveness, utilization levels, and process load balance to help upper management understand whether improvements were driven by better planning, smarter distribution of work, or stronger integration between human effort and technology. In many organizations, teams deliver strong outputs but mask unsustainable workload patterns. A time-bound view exposes these patterns and creates a baseline for more resilient capacity planning in the future.
Team AI Adoption and Tech Enablement expand the process narrative to show how digital tools reshaped the team's operating system. AI Adoption demonstrates which activities benefited most from automation or intelligent assistance and quantifies how deeply these tools are embedded into the team's weekly routines. Tech Enablement complements this by quantifying the concrete gains produced through automation vs. augmentation.
People
Here, the conversation shifts from what the team delivered to the talents that enabled delivery. Team Composition establishes a baseline by showing growth, mobility, and structural shifts across the year. Changes in headcount mix or function allocation reveal how the organization responded to new demands.
Critical Roles Value Contribution highlights where expertise had the greatest strategic impact. Most teams rely on a small set of roles that disproportionately influence delivery velocity, technical quality, or product trajectory. By identifying those roles and quantifying their contribution, the view helps leaders understand where the organization is most dependent, where succession risk may be concentrated, and where additional development or hiring investment would unlock the most value.
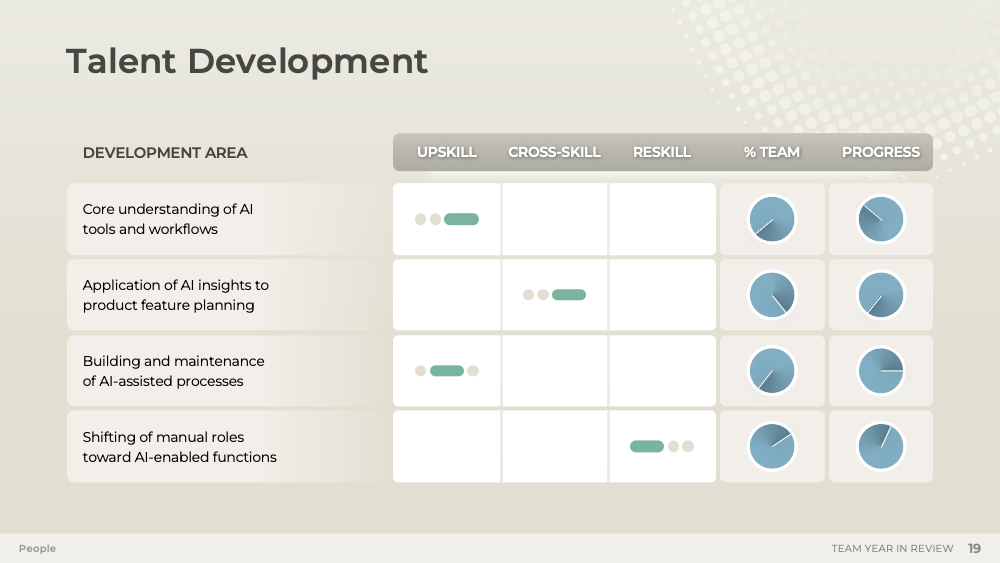
A comparison between Skill Importance vs. Maturity assesses whether the team's current capabilities match what the future demands. The framework surfaces capability gaps that may not be visible through role titles alone. By contrasting importance with maturity across both technical and non-technical skills, the organization gains a clearer understanding of its readiness for the next cycle of projects, technology adoption, and market shifts.
Future Plan
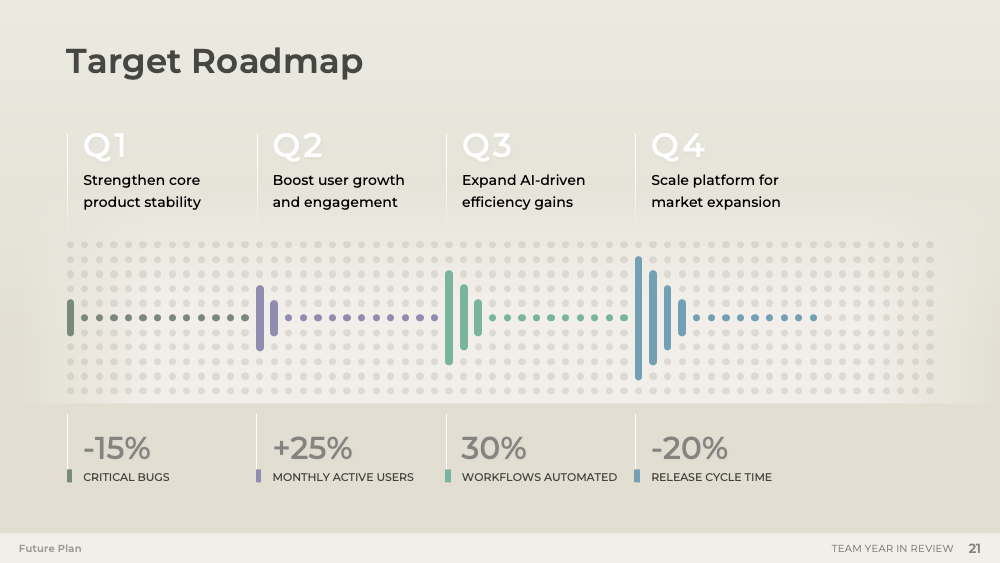
To conclude the year-in-review, discuss where the team intends to deploy its momentum next. By mapping upcoming initiatives against benefit and effort, stakeholders see a concise, evidence-based way to compare opportunities and understand the strategic posture of the team.

The Target Roadmap translates priorities into a quarter-by-quarter operating path. A roadmap that ties each quarter to a central objective and tangible targets helps teams align around what must be true for the plan to succeed. It gives structure without locking the organization into excessive rigidity. In environments defined by AI advancements, evolving customer expectations, and ongoing cost pressure, leaders often need both ambition and adaptability. A roadmap grounded in measurable outcomes provides that balance and sets expectations for sequencing, highlights interdependencies, and provides a shared cadence for delivery teams and stakeholders.
Conclusion
A strong Team Year in Review does more than recap activity. It clarifies how conditions, choices, capabilities, and execution combined to shape results, then points forward with intent. When teams present their year this way, they build trust in their judgment, strengthen alignment across functions, and equip leaders to make smarter, faster decisions in the cycle ahead.


