










Revenue strategy sits where pricing, retention, and go to market choices meet. The stakes are measurable. McKinsey research on the S&P 1500 found that a 1 percent price increase, at stable volume, lifts operating profit by roughly 8 percent. Bain reports that only 21 percent of B2B companies capture the full value of the sales plays they claim to run. Small commercial errors compound fast.
Diagnose the Revenue Base Before Setting the Target
Most growth plans fail because they start with an ambition instead of a diagnosis. This section reverses the order. It establishes what the revenue base does, decomposes the movement between last year and next, and names the gaps that must close for the target to hold. Leadership stops debating whether the number is achievable and starts debating which lever carries it.
A company that plans 20 percent growth on a base with 11 percent gross churn needs 31 percent in new and expanded revenue to reach the target. That distinction rarely appears in a board deck, so the commercial team receives an acquisition goal when the real constraint is retention. Benchmarkit's 2025 B2B SaaS study reports median net revenue retention at 101 percent, which means the average company grows almost nothing from its installed base.
Managers reach for the revenue state view at the start of a planning cycle or a quarterly review, when the question is whether performance is healthy or merely on plan. Three metrics sit side by side with year over year deltas: total revenue, gross margin, and net revenue retention. The design intent is tension. Revenue can exceed plan while margin erodes 80 basis points and retention barely clears 100 percent. The deltas matter more than the absolute values, so the prior-year comparison should never be left blank.

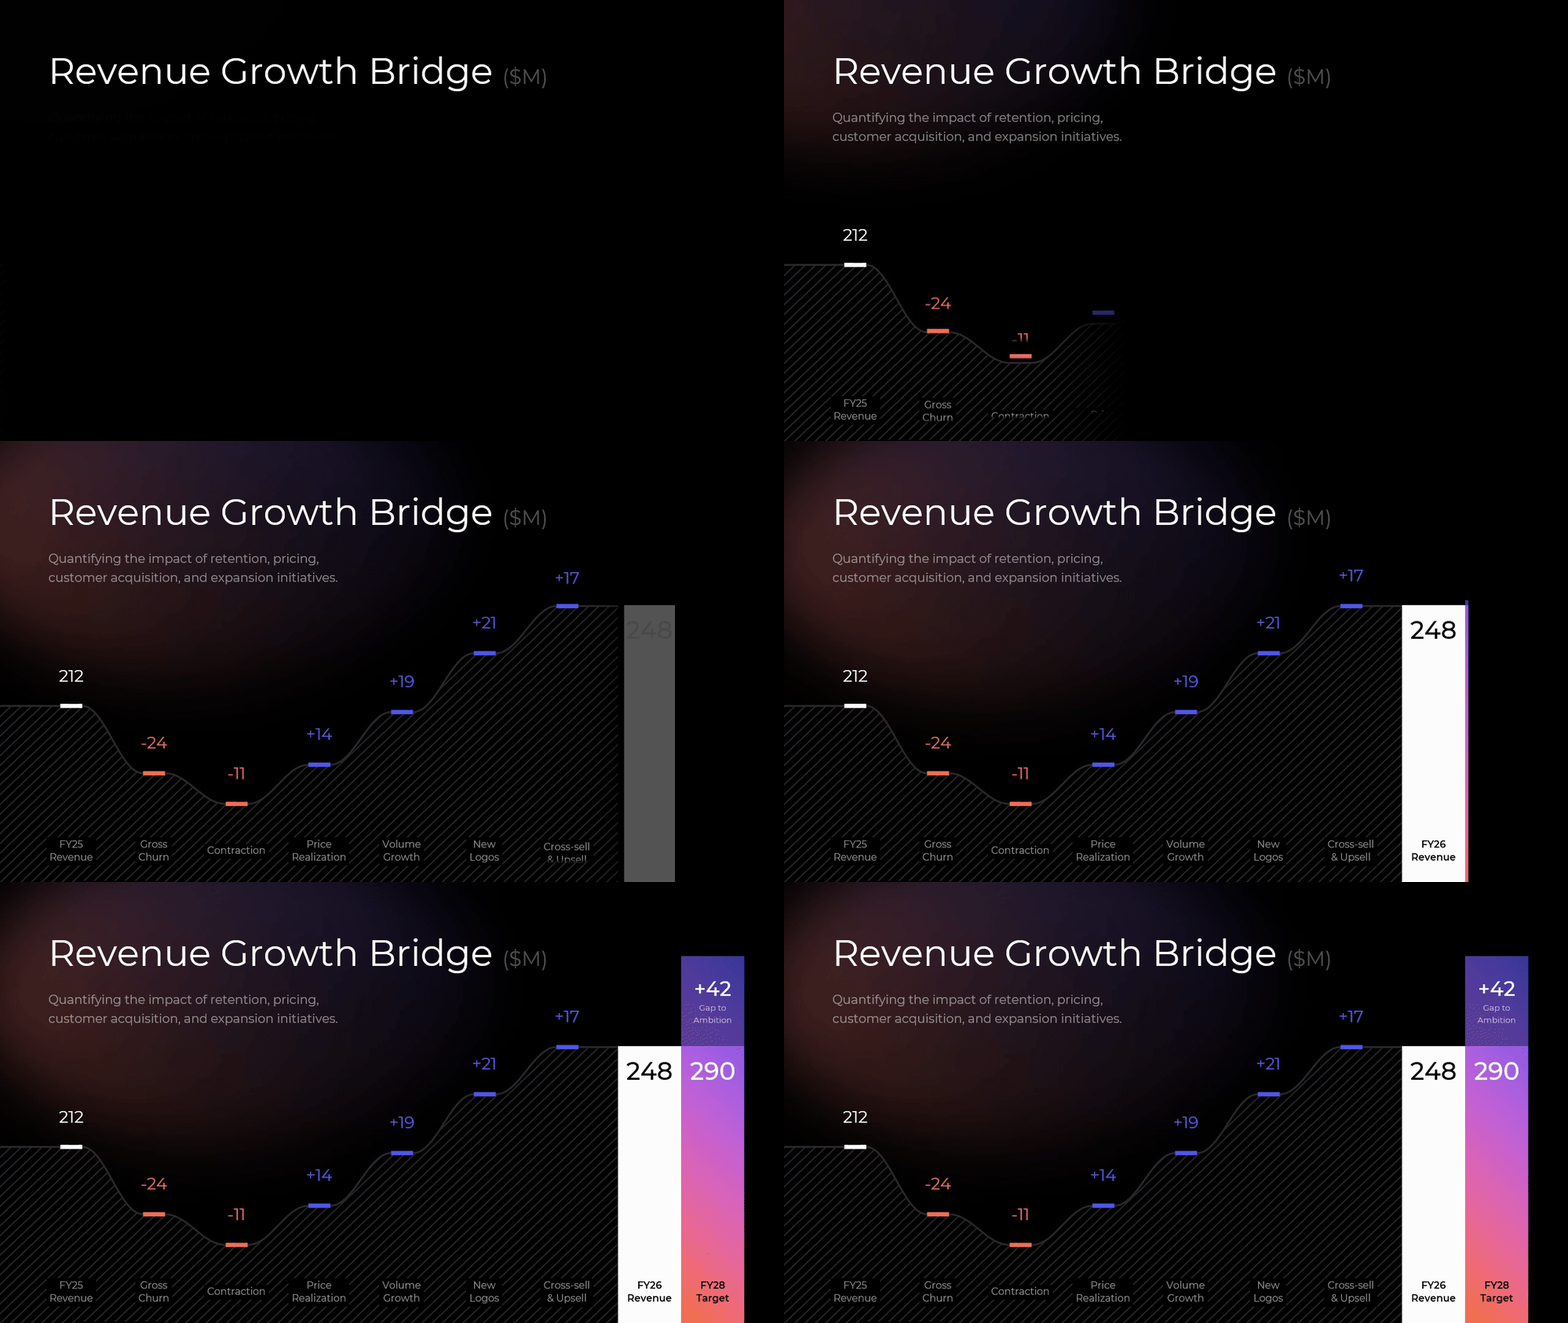
The growth bridge answers the question every executive asks next: where do the extra dollars come from. A waterfall chart walks from prior-year revenue to the forward plan through separate bars for gross churn, contraction, price realization, volume growth, new logos, and cross-sell, with the gap to the longer-term ambition held apart from the operating plan. The discipline comes from the arithmetic. Every bar needs a named owner and a supporting assumption, and the bars must reconcile to the closing number. A bridge that does not tie is a wish list.
The gap diagnosis converts each shortfall into a dollar figure with evidence beneath it. Three buckets carry a value and three supporting facts each: demand generation, retention and expansion, and conversion and price. A demand gap might read as top of funnel down 14 percent in priority segments, 72 percent of pipeline from one channel, and 38 percent of leads never qualified. Managers should size these buckets from their own funnel and renewal data before the workshop. Three sharp numbers move a decision. Ten soft ones stall it.

Where to Play and Where to Stop
Growth resources spread evenly across every segment produce even mediocrity. This section forces a portfolio decision. Segments get sorted into invest, defend, and exit categories, product lines get compared on revenue against profit contribution, and cohorts get tested against a return threshold. The outcome is a shorter list of places the company will compete, and an explicit list of places it will stop.
Bain and Company's profit pool research, published in Harvard Business Review by Orit Gadiesh and James Gilbert, established the point this section rests on: profit share often matters more than market share. The largest revenue block is frequently not the most valuable one. A mid-market suite at 54 million dollars can contribute less margin than a support line at 26 million, and the company that funds the larger block by default funds the wrong one.
The where to play view belongs in the annual strategy session, when investment gets allocated across segments. Segments appear as blocks sized by revenue and grouped into three postures: invest to win, defend and harvest, and exit or restructure. The grouping is a commitment device. A segment placed in defend does not receive incremental headcount, and one placed in exit needs a stated path. Teams should classify against two axes they can defend, usually market attractiveness and right to win, and resist the urge to place a favoured segment in invest without data.

The profit pool view is the counterweight to a revenue-only portfolio review. Seven product lines appear as blocks sized by revenue, which makes the comparison against profit contribution immediate and uncomfortable. The layout shows scale and value in one frame rather than two separate tables. Managers should populate it with fully loaded margin, including cost to serve and support load, not gross margin alone. Legacy modules and professional services lines are the usual surprises, since both look healthier before service cost gets allocated.

Customer economics gives the portfolio decision a financial floor. Four segments are compared on lifetime value to acquisition cost ratio, contribution margin, and payback period, against a policy floor of 3.0 times. A segment at 2.7 times sits below the floor and needs a cost, price, or channel change, and the view makes that visible without argument. Managers should set the floor to match their cost of capital and read payback alongside the ratio. A segment with a strong ratio and a 19 month payback still consumes cash the company may not have.

Download presentation

Revenue Strategy
PowerPoint
19 Slides
To continue, enter your email:
How to Build a Monetization and Pricing Architecture
Pricing is the fastest lever in the commercial system and the least systematically managed. This section treats monetization as a set of design decisions rather than a number on a rate card. It separates who pays, what they pay, how much, for what, and through which mechanism, compares model types on predictability and margin risk, then traces the gap between list price and price collected.
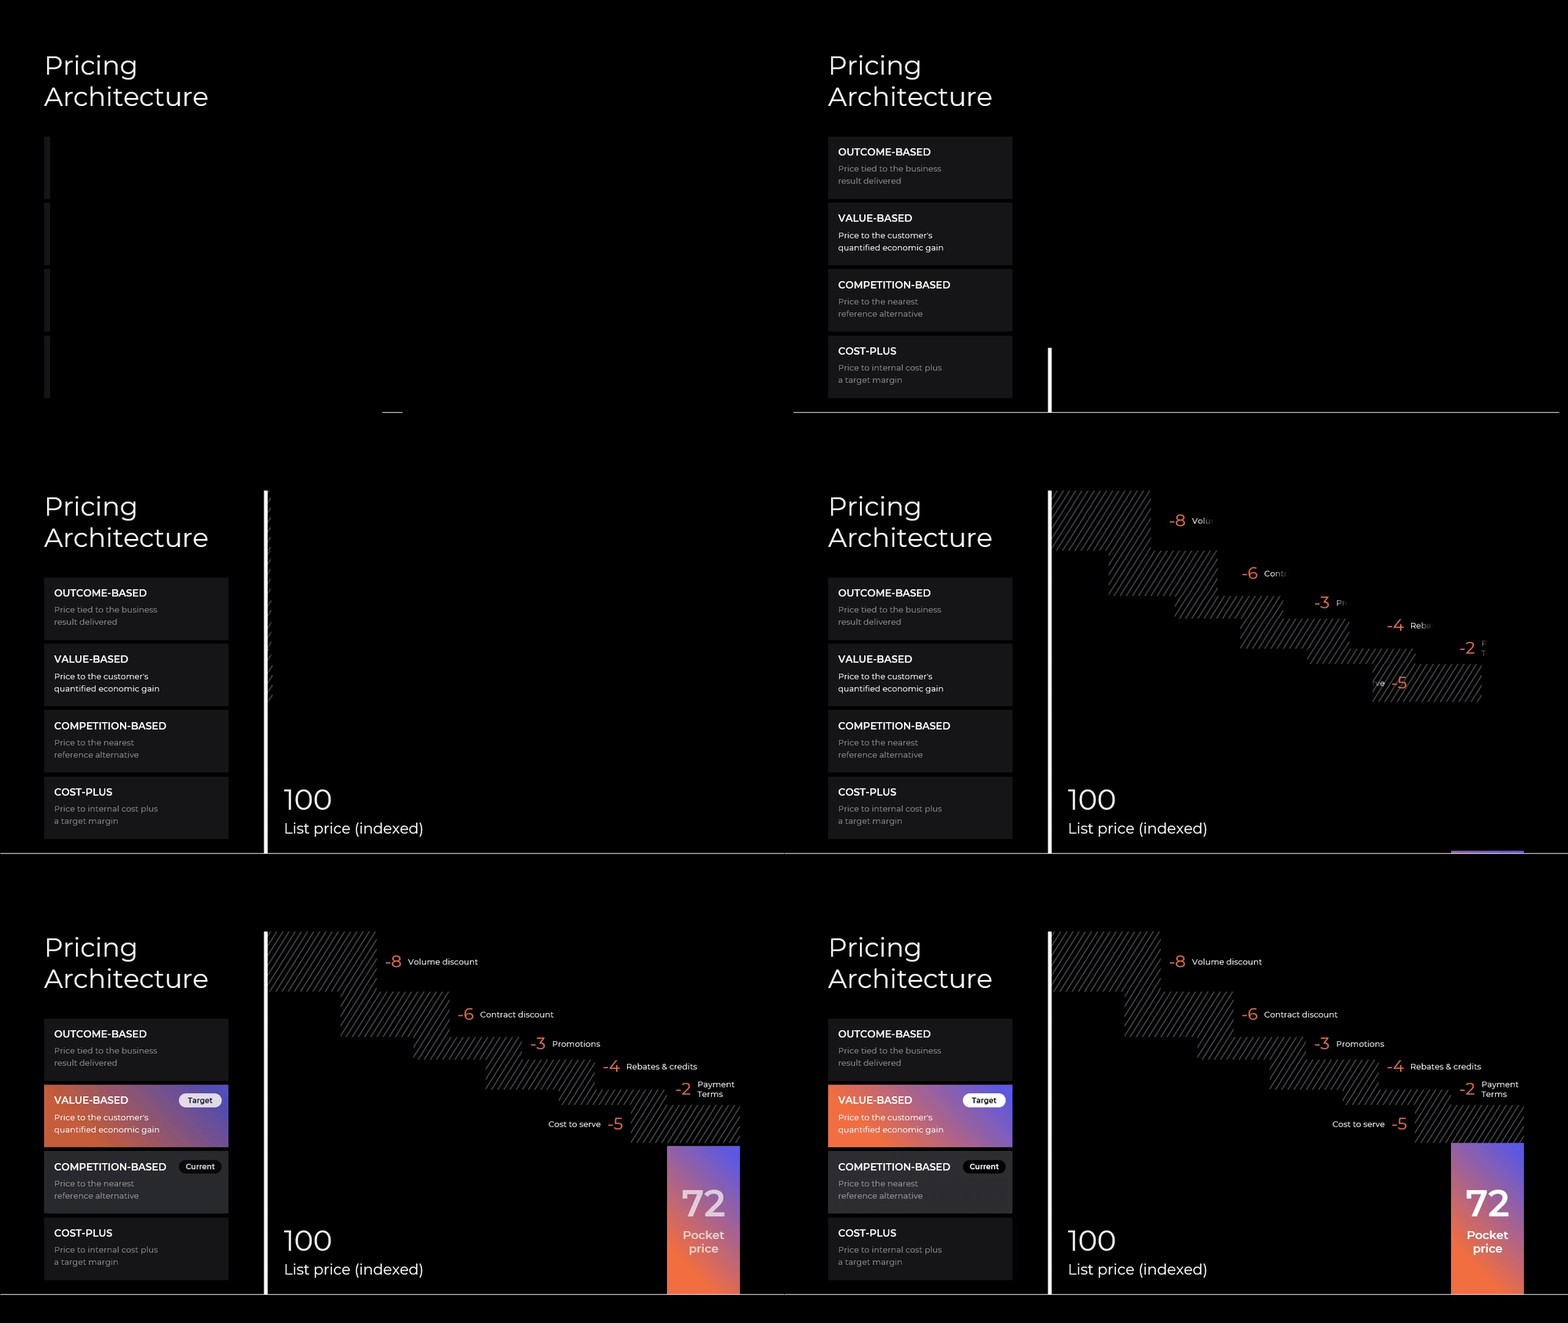
McKinsey's analysis of B2B SaaS companies found that firms with advanced pricing practices reach net revenue retention roughly 16 percentage points higher than firms with basic practices. Consider a company with a 12 percent discount policy and a 19 percent realized average. On 100 million dollars of list value, that 7 point gap is 7 million dollars of margin surrendered through approvals no one tracked.
The revenue model architecture view is the starting point when a company considers a new monetization approach or a new segment. It poses five questions in sequence: who pays, what is paid, how much, for what, and how. Each question opens alternatives most teams never consider, including sponsors and advertisers as payers, credits and shares as currency, and auction or dynamic mechanisms as method. Managers should work through all five before they settle on a model, because the common failure is to change price level while every other decision stays fixed by habit.

The monetization models view supports the choice between structures. Five model types appear with current revenue share and a read on predictability, scalability, and margin risk: one-time, subscription, usage, outcome, and hybrid. The comparison makes the tradeoff explicit, since outcome-based pricing carries the highest willingness to pay and the highest margin risk together. Teams should populate the share column from their own billing data, then mark a target mix. The gap between current and target mix is the real output.

The pricing architecture view is where a pricing review becomes a plan. It combines two mechanics in one frame. The upper structure ranks four pricing logics from cost-plus through competition-based and value-based to outcome-based, which positions the company against where it wants to price from. Below it, a pocket price waterfall walks from an indexed list price of 100 down to a realized 72 through volume and contract discounts, promotions, rebates, payment terms, and cost to serve. The waterfall comes from Michael Marn and Robert Rosiello's work in Harvard Business Review. Managers should populate every step from transaction data, because the largest leaks sit in steps that never appear on an invoice.
Recover Leaked Revenue and Assign Ownership
Revenue already earned but never collected is the cheapest growth available. It needs no new customers, no new product, and no extra acquisition spend. This section quantifies the leakage, then fixes the structural cause by assigning every stage of the revenue lifecycle to an accountable function with a governing metric. Recovery stops depending on individual diligence and starts depending on process.
The scale is usually larger than expected. A leakage profile with 8.4 million dollars in discount slippage, 6.7 million in missed price increases, 4.2 million in renewal slippage, 3.1 million in unbilled usage, and 2.9 million in unpriced scope creep totals 25.3 million. For a company at 248 million dollars in revenue, that is roughly 10 percent of the base, recoverable through policy enforcement rather than market share gains.
The leakage map belongs in a margin review or a pricing governance meeting. Five categories each carry a dollar value and a one-line root cause, which separates this from a generic list of pricing problems. A category reading 62 percent of eligible contracts renewed without the contractual uplift points at a specific process failure with a specific owner. Managers should size each category from contract and billing data, then rank by value and ease of fix. Discount slippage and missed uplifts are usually the fastest two to close.

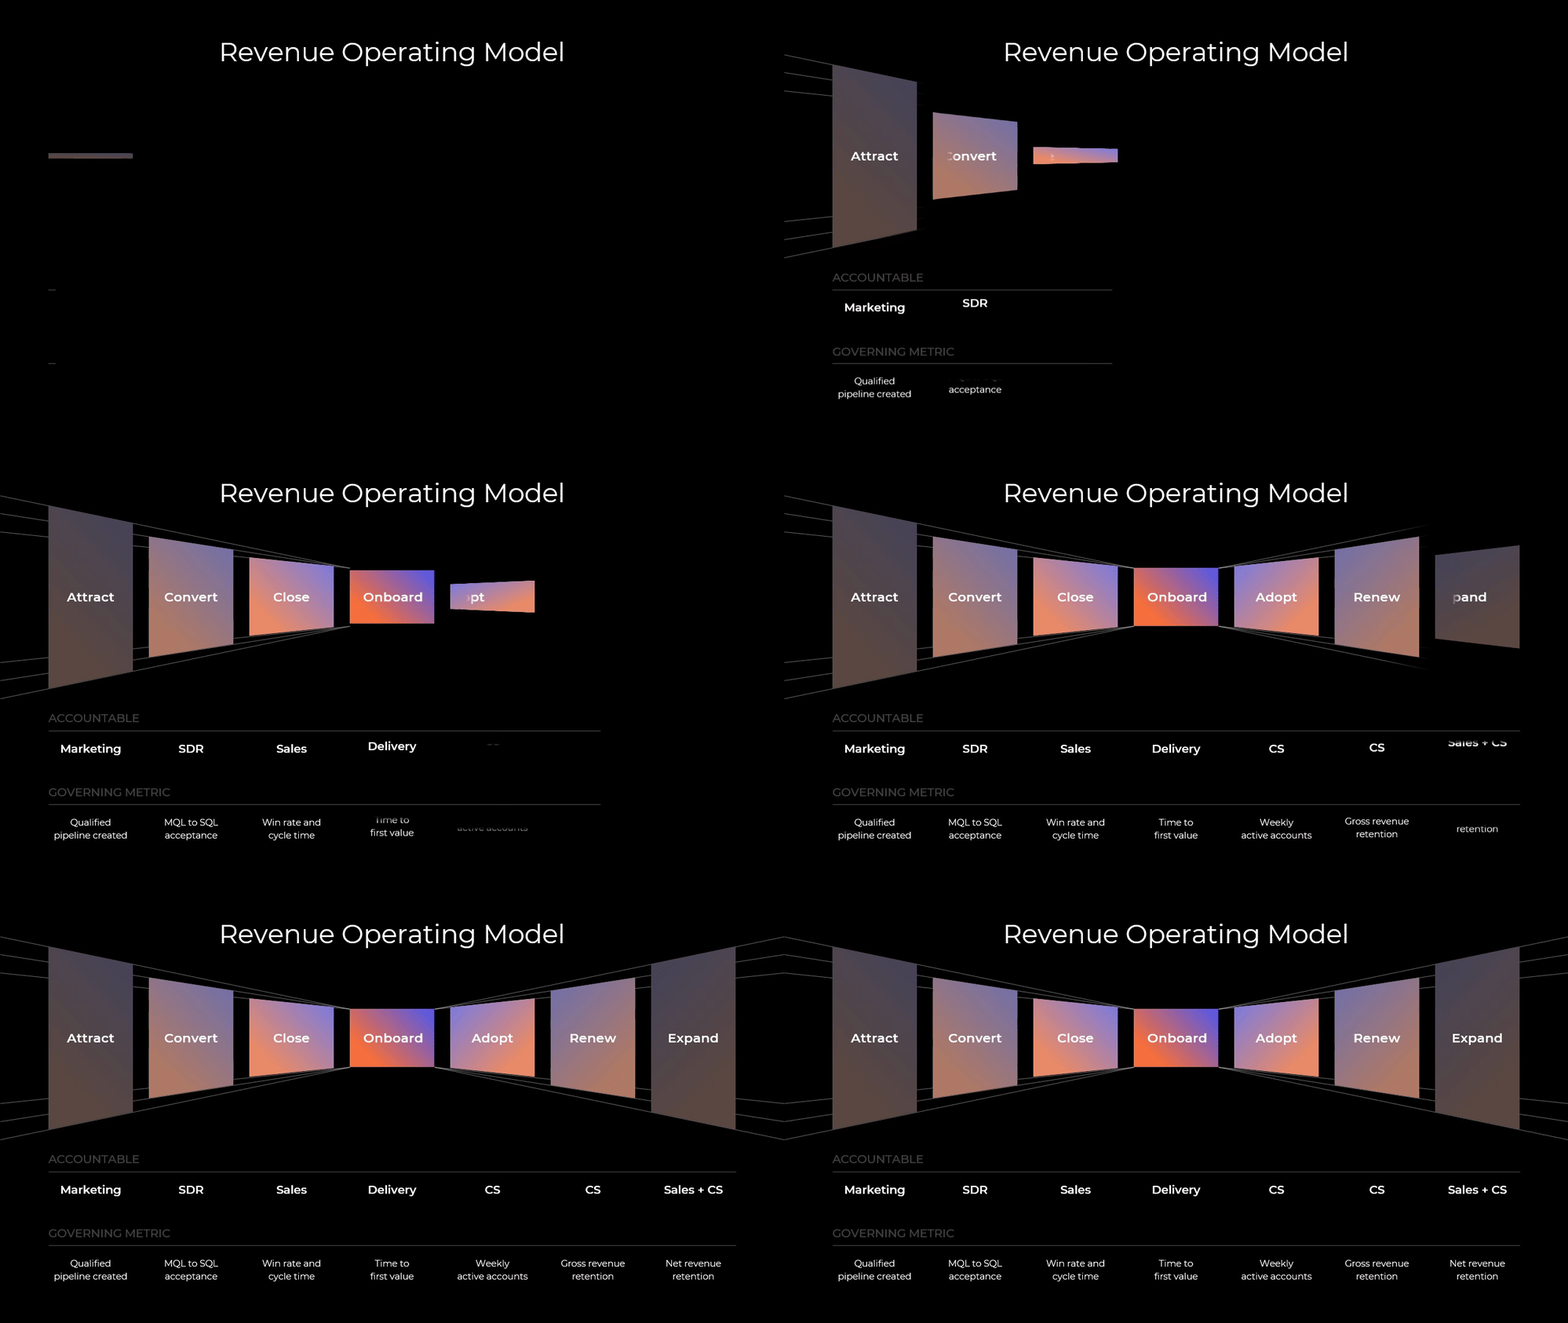
The revenue operating model view addresses why leakage recurs. Seven lifecycle stages run from attract through convert, close, onboard, adopt, renew, and expand. Two rows sit beneath each stage: the accountable function and the single governing metric. The structure exposes handoff gaps, which is where most revenue quietly disappears. Teams should insist on one accountable function per stage rather than a shared owner, and confirm each governing metric is already reported somewhere. A metric that needs a new report will not survive the quarter.
The channel investment view answers where incremental commercial spend should go. Four routes to market are compared on acquisition cost index, gross margin, and revenue share, each with a stated purpose and a control versus scalability read: direct enterprise sales, digital self-serve, partners and resellers, and cloud marketplaces. The comparison is useful because it prices control. A direct channel with a CAC index of 138 buys control that a marketplace at 22 does not. Managers should map each channel to the deal profile it serves, then check whether current spend matches the revenue share each channel returns.

Download presentation
Revenue Strategy
PowerPoint
19 Slides
To continue, enter your email:
Sequence the Plan and Test It Against Scenarios
A diagnosis without a sequence produces a list of good intentions. This section converts the analysis into an executable plan. Capacity gets tested against the target, initiatives get scored and tiered into now, next, and later, and the plan gets stressed against upside and downside cases. Leadership leaves with a defensible commitment rather than a single-point forecast.
Gartner's research on AI in sales makes the related point that freed capacity does not convert to revenue on its own, and that leaders must direct it deliberately. The same logic applies to initiatives. Two low-investment actions worth 12.6 million dollars combined, delivered in the first quarter, fund the high-investment capability build that pays 12.4 million two years out. Reverse the order and the company runs out of both patience and cash.
The forecast and capacity view is for the moment when a target has been set and the question turns to whether the team can carry it. It pairs a committed-versus-landed revenue chart across six quarters with the inputs that drive it: revenue target, average deal size, required capacity, and the capacity gap. The mechanic is simple division, and that is the point. A target divided by average deal size and quota gives a headcount requirement that either exists or does not. Managers should fill this history honestly, because a persistent gap is a forecast problem no capacity plan will fix.

The initiative prioritisation table is the decision artifact of the framework. Each initiative carries an expected revenue value, an investment level, a composite score, and a tier of now, next, or later. The scoring method matters more than the score, because a transparent weighting of value, confidence, and effort survives challenge while a subjective ranking does not. Teams should keep the now tier to two or three low-investment, high-confidence items, and force every later-tier initiative to state what would move it forward. An initiative with no promotion condition is a deferral, not a plan.

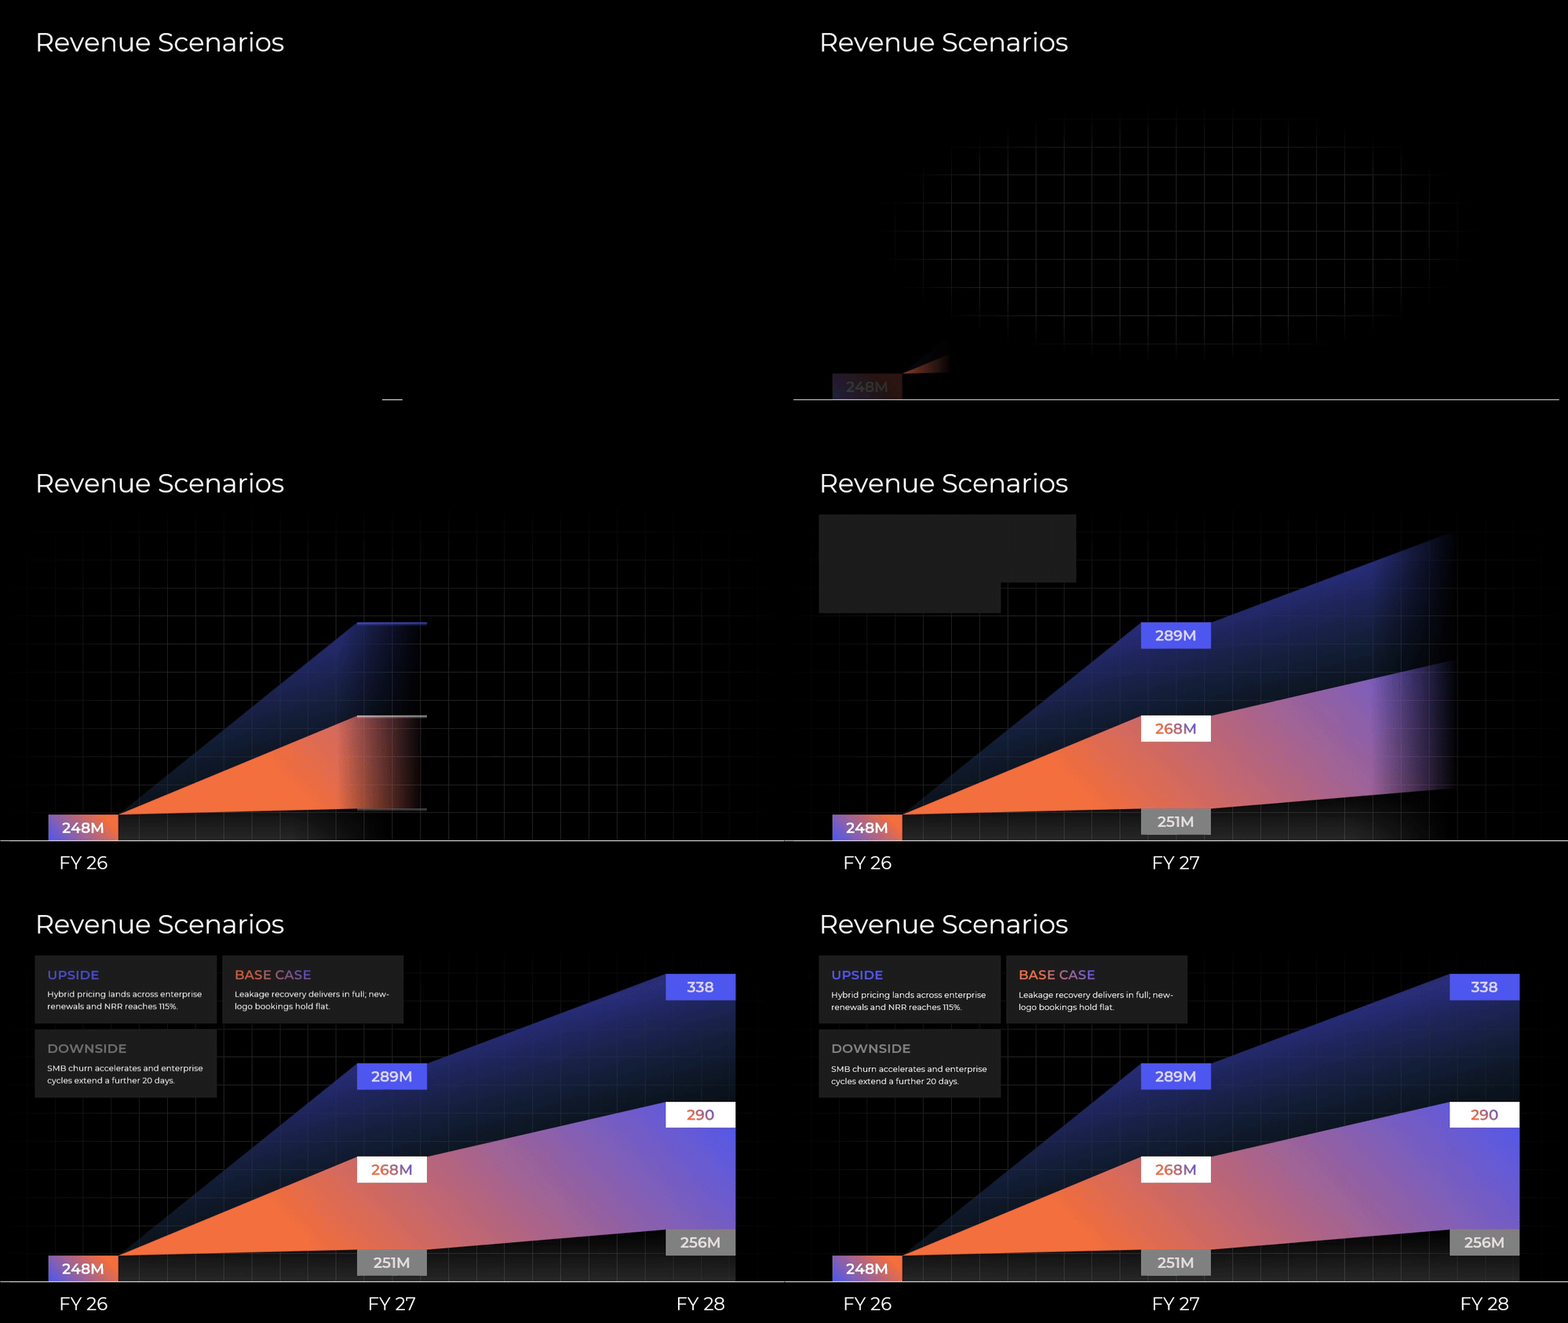
The scenario view turns a plan into a commitment leadership can defend. Three revenue paths run across three fiscal years, each with a stated trigger condition rather than a percentage adjustment. An upside case might rest on hybrid pricing that lands across enterprise renewals with retention at 115 percent, while a downside case rests on faster SMB churn and enterprise cycles 20 days longer. Managers should tie each case to conditions observable within a quarter, then agree in advance which case triggers which response. A scenario without a pre-agreed action is an interesting chart and nothing more.
Revenue strategy fails in the seams. A target set without a diagnosis, a segment funded without a profit read, a price list that never matches the price collected, a renewal that belongs to no one, an initiative list with no sequence: each gap is small alone, and together they explain why so many growth plans miss. This framework closes the seams in order. It measures the base, decomposes the movement, names the gaps, chooses where to compete, designs the monetization model, traces the leakage, assigns ownership across the lifecycle, tests capacity, and sequences the work against scenarios with pre-agreed responses. What emerges is not a forecast but a commercial operating system, one where every point of growth traces to a decision, an owner, and a metric. Companies that treat revenue as a designed system rather than an annual negotiation stop arguing about the number and start managing the mechanisms that produce it.
Download presentation
Revenue Strategy
PowerPoint
19 Slides
To continue, enter your email:


