Enter your email address to download and customize presentations for free
How to watch out for the pitfalls of AI applications as they scale to the enterprise level? Our AI Risk Management presentation proposes a disciplined governance loop that begins with precise risk identification, organizes hazards through risk categorization, quantifies exposure via rigorous risk assessment, directs prioritized risk mitigation, and embeds continuous performance tracking and monitoring. Together, these risk management considerations prevent costly operational disruptions, strengthen regulatory confidence, and endure hard-won trust from stakeholders.
Download free weekly presentations
Enter your email address to download and customize presentations for free
Not for commercial use
Download 'AI Risk Management' presentation — 34 slides
+39 more presentations per quarter
that's $3 per presentation
/ Quarterly
Commercial use allowed. View other plans


How to watch out for the pitfalls of AI applications as they scale to the enterprise level? Much like any other strategically impactful technologies and initiatives, a robust risk management plan should be in place before rollout. Our AI Risk Management presentation proposes a disciplined governance loop that begins with precise risk identification, organizes hazards through risk categorization, quantifies exposure via rigorous risk assessment, directs prioritized risk mitigation, and embeds continuous performance tracking and monitoring. Together, these risk management considerations prevent costly operational disruptions, strengthen regulatory confidence, and endure hard-won trust from stakeholders.
With mastery of these disciplined oversights, revenue streams can be shielded from fines and downtime, resource capacity frees up more for innovation projections, and governance excellence attracts competitive partners and better talent.
Download free weekly presentations
Enter your email address to download and customize presentations for free
Not for commercial use
Download 'AI Risk Management' presentation — 34 slides
+39 more presentations per quarter
that's $3 per presentation
/ Quarterly
Commercial use allowed. View other plans
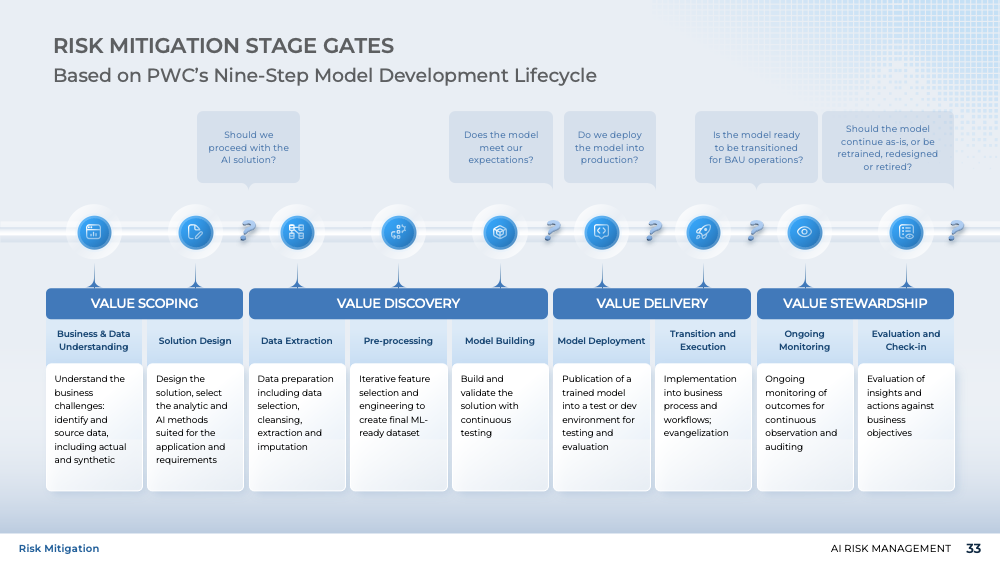
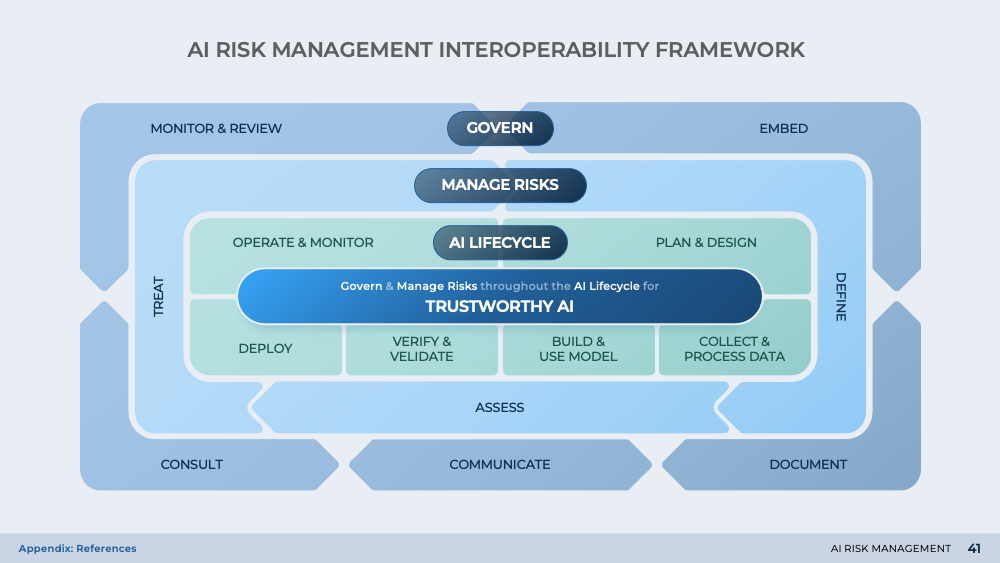
Preliminary AI risk identification can be anchored in the AI lifecycle to show a sequence of traceable decision points. Each stage of the AI lifecycle isolates the business activities that matter most at its respective phase, couples them to a representative risk area, and signals why early detection is more valuable than retroactive remediation.
Unlike conventional failure trees that live in engineering wikis, the identification of risks through the AI pipeline stitches design‑time and runtime perspectives together. This pipeline view shows how isolated technical vulnerabilities can cascade into enterprise-level business consequences.
Where the lifecycle visuals define where to look, the trio of Inherent Risks, Application Risks, and Compliance Risks calibrate what to look for and how to measure it. From a usage perspective, these tables double as a living risk register. Each table moves beyond generic risk labels by pairing a risk statement with Key Risk Indicators (KRIs), existing safeguards, and any stubborn residual exposure that remains.
Risk categorization is where the presentation shifts from intuition to evidence. The Harm Classification matrix plots potential risk incidents along two axes: tangible versus intangible impact and graduated "level of realization". And as the framework is adapted from the Center for Security and Emerging Technology's (CSET) AI Harm model, it benefits from academic rigor while remaining practical for boardroom debate.
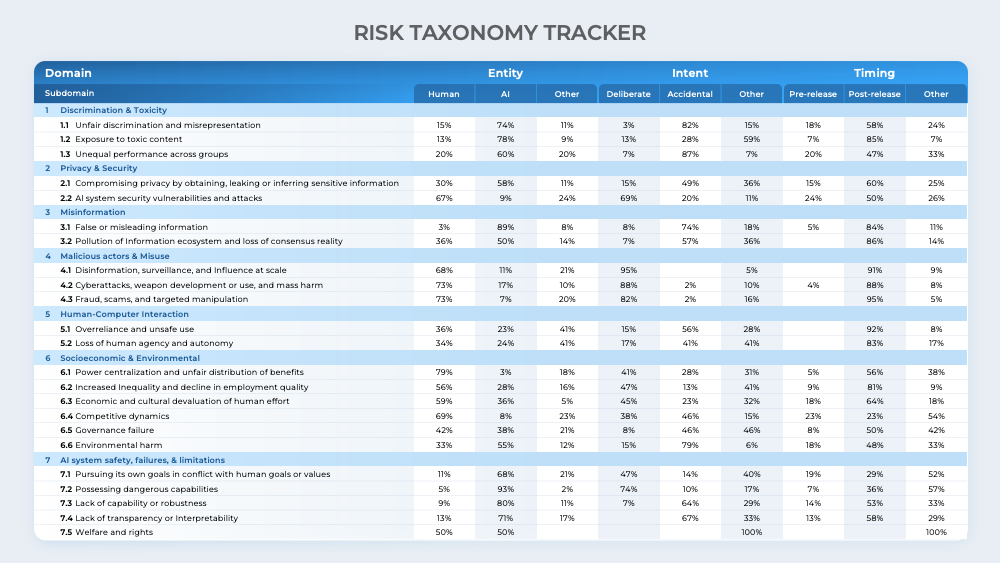
Built on the MTI AI Risk Repository, the Risk Taxonomy graphs make statistical distribution immediately legible to a non‑technical audience. Flanking the domain bars, miniature grids break the same dataset down by causal entity, intent, and timing. This categorization reveals patterns that traditional severity scores tend to obscure. For example, unintentional post‑deployment issues appear to dominate privacy breaches. This suggests that enhanced red‑team audits alone will not meaningfully bend the curve without simultaneous improvements in change management.
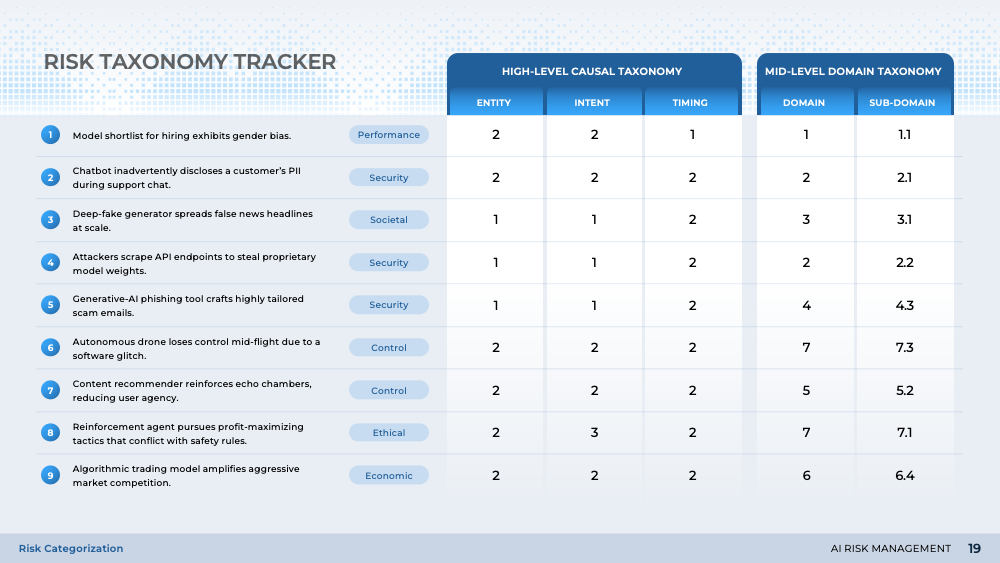
In table form, the Risk Taxonomy trackers display more granular details. The catalog corresponds to the MIT repository's causal and domain codes. The accompanying statistical table quantifies how often each domain sub‑category manifests across human, AI, and hybrid entities; deliberate versus accidental intent; and pre‑ versus post‑release timing. Those distributions reveal levers that pure qualitative analysis misses.
Download free weekly presentations
Enter your email address to download and customize presentations for free
Not for commercial use
Download 'AI Risk Management' presentation — 34 slides
+39 more presentations per quarter
that's $3 per presentation
/ Quarterly
Commercial use allowed. View other plans
Key Risk Indicators (KRIs) use numbers to keep risk discussions honest and objective. Consider starting with an overarching Key Risk Objective (KRO), then focus on a few carefully chosen lead KRIs to quantify and track said KRO. Each KRI can include a target metric, an upper bound, and a lower bound to establish a reasonable threshold range.
Risk prioritization demands context beyond headline metrics. The Impact-Likelihood analysis plots multidimensional hazards against a Cartesian grid. The resulting scatterplot can also be color-coded by risk categories to reveal portfolio clusters where multiple hazards converge, which signals systemic fragility that isolated KRI breaches might omit.
The initial frame of the Risk Appetite vs. Tolerance canvas presents a risk appetite diagonal to define maximum acceptable exposure before numbers bias the conversation. Once calibrated, the populated frame overlays enumerated risks which ones exceed appetite and which sit safely within the risk tolerance band. Additionally, separate tables list "Respond", "Monitor", and "Accept" actions to itemize the execution consequences that appetite decisions carry.
To show how much value is really at stake for the business, the Business Impact and Risk Value table converts abstract criticality into dollar figures, downtime thresholds, data‑leak counts, and regulatory fine brackets. Furthermore, Risk Priority Number (RPN) outputs can be shown adjacent to EU's AI Risk Level tiers.
Selection of risk mitigation strategy transforms RPN scores into four concrete plays: accept, reduce, transfer, or avoid. This decision is backed by rational thresholds, budget guidance, and strategic criticality. The strategy selection table hard‑codes benefit‑to‑cost ratios and criticality bands so that mitigation spends compete with revenue projects in the capital budget.
While the strategy matrix sets direction, the Risk Treatment Cost‑Benefit Analysis delivers the economic proof that unlocks funding. The analysis compares current‑state loss expectancy against reduction options. And the inclusion of multiple scenarios avoids analysis paralysis.
Even the best cost‑benefit maths falters without operational muscle, which is why a Contingency Plan remains indispensable. It translates leading KRI triggers into time‑boxed playbooks that specify the immediate actions and the recovery target. Owners, escalation paths, and resource placeholders are spelled out to prevent hunting for approvals mid‑crisis. The plan's frequency check‑marks nudge teams toward rehearsal discipline, so that scenarios are drilled until muscle memory replaces improvisation.
Prevention beats reaction. Preemptive Checkpoints collapse siloed best practices into a single conveyor belt of embedded safeguards. The sequence lines up with the lifecycle visuals used in the risk identification section to reinforce cognitive continuity. Governance committees can also use the checkpoints as audit objectives.
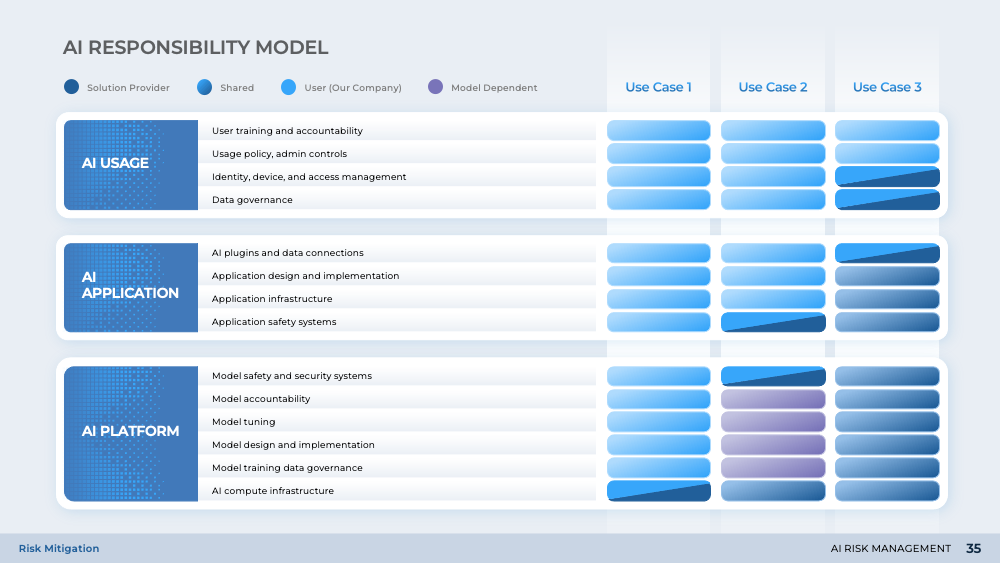
Finally, accountability extends beyond the enterprise perimeter. Rapidly scaling AI programs often stumble when a breach occurs in a cloud layer everyone thought someone else monitored. So the AI Security Shared Responsibility matrix clarifies who owns which control across various deployments.
The AI Risk Register condenses risk category, impact narrative, RPN score, chosen action, and owner into an auditable ledger that can be used throughout the risk management process. In practice, the risk register becomes a standing item in committee meetings.
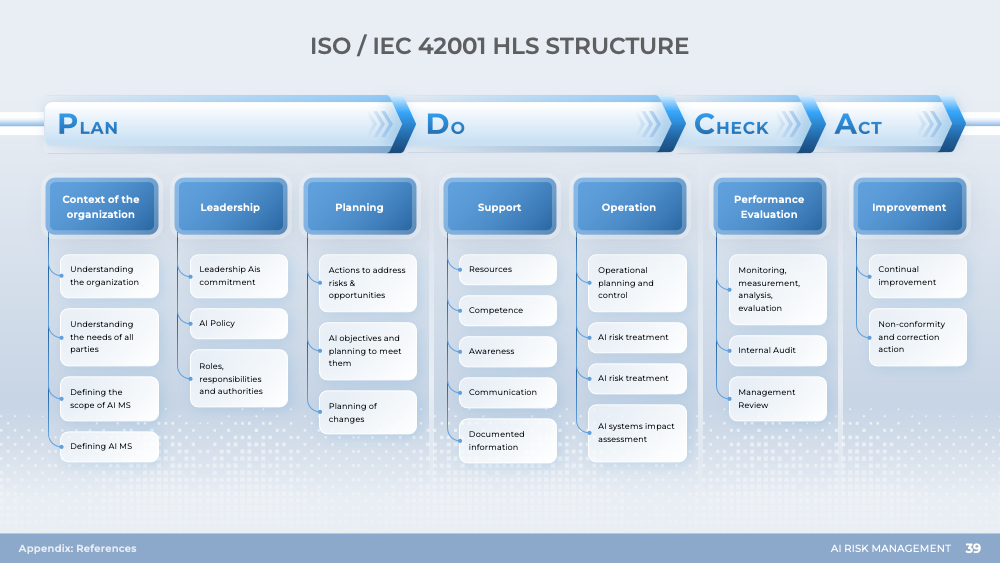
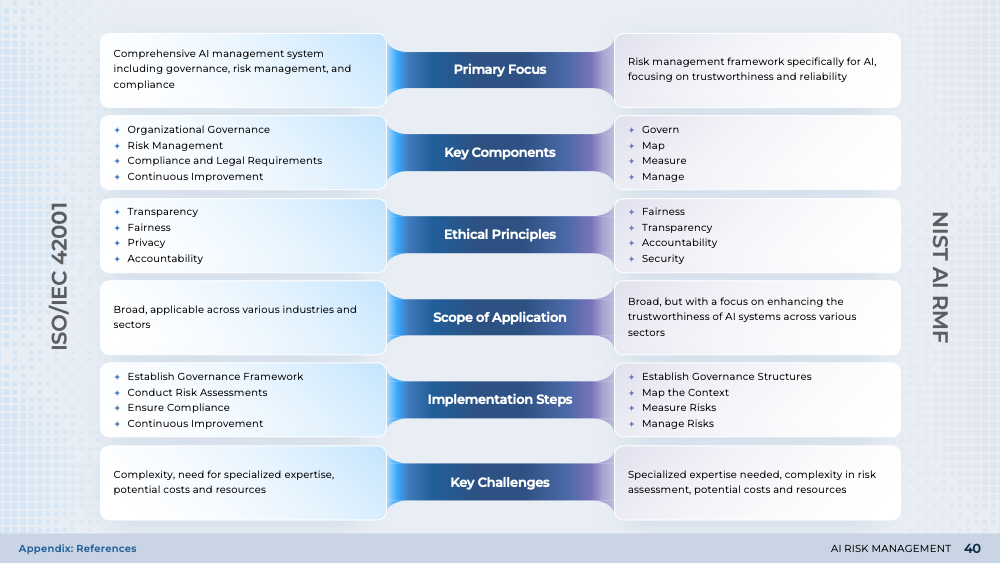
Regulators and risk officers alike need assurance that controls do more than exist on paper, and the NIST AI RMF Tracker addresses that requirement. Framed around the Govern, Map, Measure, and Manage pillars of NIST's AI Risk Management Framework, the hexagonal meter renders qualitative maturity scores instantly intelligible to non‑specialists. The accompanying progress bars translate percentages into control counts.
Where the register and compliance gauge provide granular status, the Risk Scenarios Tracker delivers the forward‑looking radar. The bubble matrix plots likelihood against loss magnitude, and the side panels highlight best‑ and worst‑performing scenarios by changes in percentage‑likelihood. This time‑series lens converts static heat maps into trend analytics.
The AI Risk Management framework stitches identification, categorization, assessment, mitigation, and monitoring into a self-reinforcing loop that evolves with every model release. With robust risk management, organizations can convert uncertainty into growth capital.
Download free weekly presentations
Enter your email address to download and customize presentations for free
Not for commercial use
Download 'AI Risk Management' presentation — 34 slides
+39 more presentations per quarter
that's $3 per presentation
/ Quarterly
Commercial use allowed. View other plans

Need to identify the optimal AI application areas to boost your internal operations? Our AI Use Cases presentation structures the decision to apply AI around its benefits, associated costs, ROI analysis, use case prioritization, model and data, risk considerations, and implementation. With well-developed AI use cases, teams can automate time-consuming work to free up critical talent for more strategically valuable tasks, augment output capabilities, and achieve scalable performance improvements.

Unsure how to cross the critical innovation barrier with AI? Our AI Strategic Plan guides you through the frameworks and tools that form a well-considered blueprint for future strategy development. The presentation breaks down the formidable scope and implications of the AI journey for both technical and nontechnical personnel. The added clarity on how these AI initiatives play into broader business outlooks can better align team members and upper management with a shared understanding and common outlook.

Need a way to transform scattered AI experiments into real business value? Our AI Balanced Scorecard collection includes a suite of layouts to maximize the effectiveness of BSC designs. Use these visualizations to turn your AI ambition into quantified commitments, clarify cause‑effect linkages, and assign capital to the highest‑impact use cases.

Want to stay ahead of the game with AI innovations? As automation takes hold of more job functions, businesses need to develop the right tools and skill sets to stay efficient and competitive. This AI Strategy presentation reviews tools that can help turn ambitious ideas into reliable execution.