


Introduction
Would you be prepared if your business function or team operation suddenly gets disrupted? A preemptive Business Impact Analysis (BIA) sets up the right expectations and equips you with an action plan for recovery. Our presentation follows the key steps of a Business Impact Analysis, from its scope, critical functions, impact assessment, recovery plan, to mitigation proposal. More than just a plan for emergencies, BIA serves as a decision-making tool that brings clarity under pressure, strengthens cross-functional coordination, and assigns effective leadership when disruption hits.

With BIA built into how an organization operates, financial safeguards are tightened, confidence with clients and regulators can be reinforced, and long-term business resilience becomes a practiced advantage.

Set the BIA Scope
As the directional anchor of any effective business impact analysis, start the process with a clear definition of the BIA's scope coverage. Without alignment on what functions to assess and over what time horizon, a BIA can quickly become either too narrow to matter or too broad to act on.
One approach to set this foundational boundary is through timeframe. For example: short, mid, and long-terms. So that disruption scenarios can be properly tiered in terms of urgency and volatility. Scope setting should also map out the business units and functions that play a crucial role and identify where operational exposure lives.

Identify Critical Functions
Understanding which functions are truly critical is where the impact analysis starts to become actionable. Teams should identify their essential activities to distinguish between everyday operations and mission-critical activities that could derail the business if disrupted. The addition of a disruption concern index builds a second layer of input: perception. This opens the door for both objective impact data and subjective team insights to inform prioritization.
Once essential functions are surfaced, criticality assessment takes prioritization further by applying weighted scores to each one. The relative weight assignment forces teams to define what matters most before an incident occurs. That discipline helps cut through stakeholder noise when competing priorities inevitably arise. It also enables faster decision-making around recovery sequencing, resource allocation, and escalation paths.

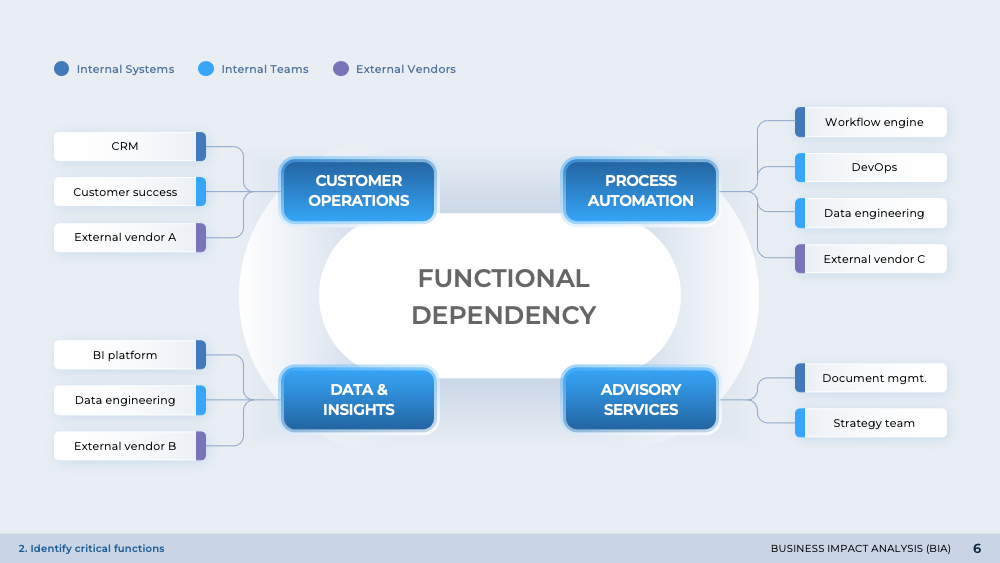
The risk concentration radar takes a different lens. It focuses less on function and more on interdependency. Rather than asking which functions matter most, it asks where disruption is most likely to originate. The diagram links each core business area to its external or structural risk sources to create a network map of vulnerability.

Assess Business Impact
The business impact profile evaluates disruption severity over time. On the qualitative side, it surfaces critical questions: how visible would a service failure be? How quickly would brand trust erode? On the quantitative side, financial consequences are calculated in hard numbers: revenue loss, penalties, and increased operating expenses.

An impact heatmap then distill those insights into a more intuitive, function-by-function comparison. By plotting each function against impact categories, the heatmap clarifies which departments carry outsized exposure and why. Rather than looking at raw scores, the heatmap shows relative risk across units to enable more confident prioritization of mitigation investments.
Financial Impact
A breakdown of financial impact brings precision to disruption modeling by quantifying cost exposure across both most-likely and worst-case scenarios. This granular examination into revenue loss, cost increases, and penalty risk ensures that no component is left buried in a single lump sum. The financial impact analysis surfaces which units represent the biggest liabilities under stress, and whether those exposures are driven by external dependencies, internal inefficiencies, or market volatility.

Operational Impact
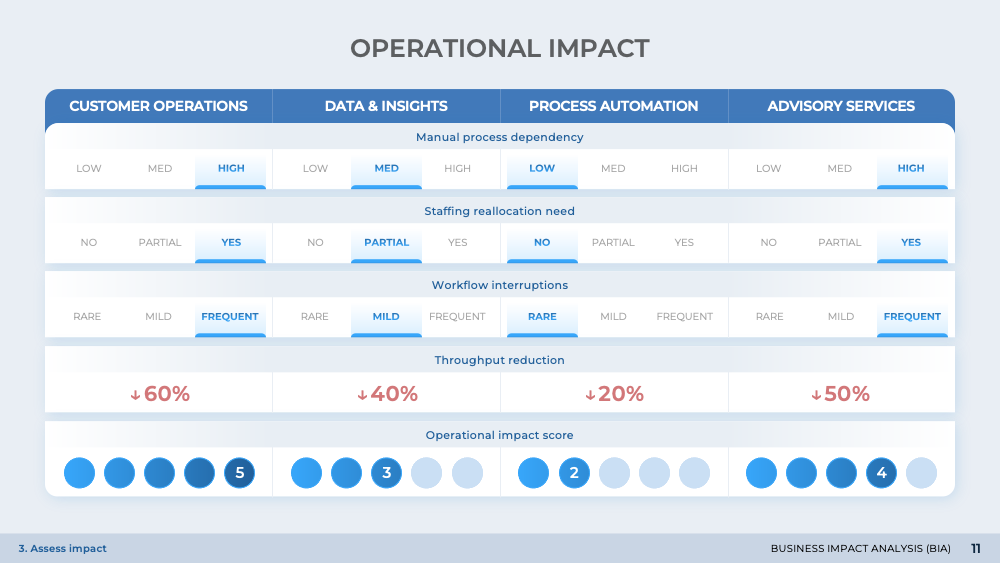
The operational Impact matrix brings the assessment back down to executional ground level. By detailing how each function is affected in terms of manual dependency, staffing flexibility, workflow interruptions, and throughput loss, it connects strategic disruption to real-world bottlenecks. That's particularly important for teams responsible for day-to-day service continuity. The structure also reveals functional tradeoffs: some units may experience frequent interruptions but recover quickly; others may run smoothly until a disruption occurs, then take days to stabilize. This consideration enables more thoughtful contingency planning.
Customer and Reputational Impact
While customer perception isn't always captured in financial metrics, it can have devastating consequences. The customer and reputational impact grid reframes disruption through the eyes of external stakeholders. It maps the likelihood of customer impact against the severity of brand damage, effectively segmenting risks into four categories: silent churn, viral backlash, brand dilution, and low concern. This is critical for functions where trust and responsiveness drive long-term loyalty. The real value of this model is its ability to flag reputational risk that doesn't show up on a balance sheet but will erode market position over time.
Not all disruptions hit at once. A time-based impact projection introduces a temporal lens to map out how disruptions evolve over immediate, short-term, and long-term windows. This is particularly relevant in scenarios involving technological displacement, regulatory shifts, or market transitions – where the disruption curve builds over time. This analytical approach separates urgency from severity. With that kind of insight, teams can layer their mitigation strategies – deploying fast fixes where needed while simultaneously planning longer-term pivots.
Plan for Recovery from Disruption
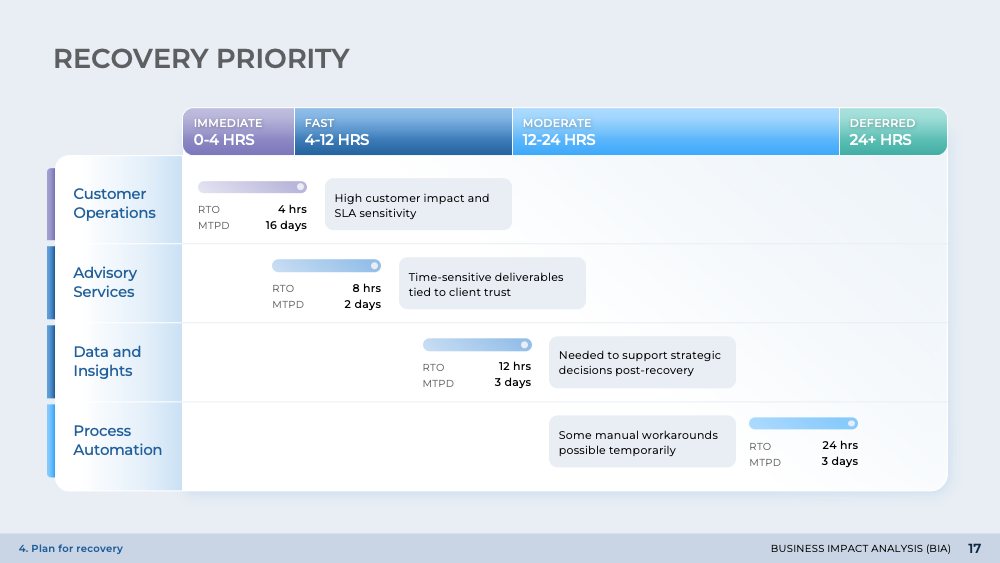
Recovery objectives, measured by metrics such as RTO and RPO, assigns tiered urgency levels and concrete timelines to each function. Recovery priority is differentiated by both time (RTO: Recovery Time Objective) and loss tolerance (RPO: Recovery Point Objective). This distinction is crucial because it anchors planning in operational reality: some functions demand rapid restoration due to direct revenue exposure, while others can absorb longer delays or operate manually.
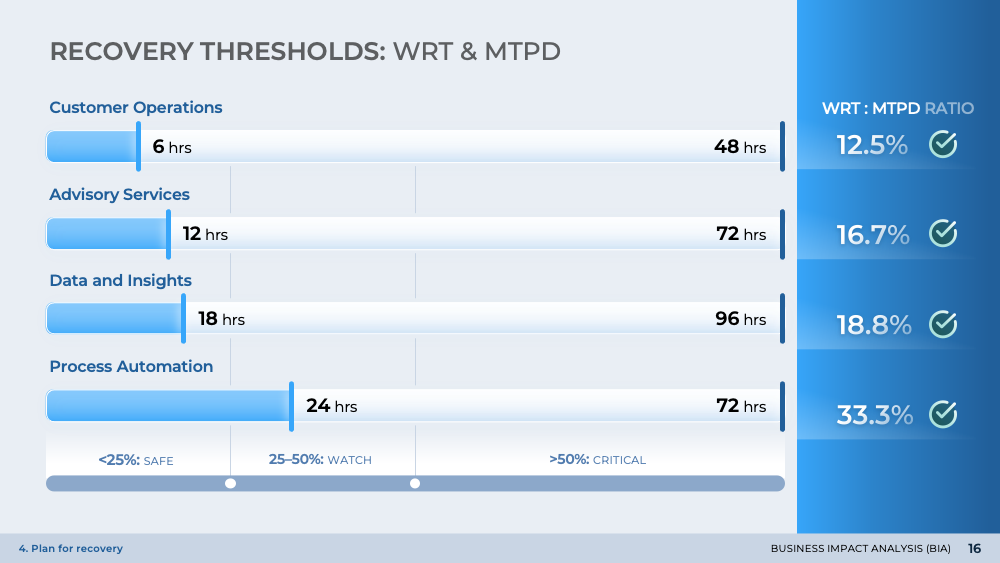
Resilience isn't just about how fast you bounce back; it's about whether you stay within the tolerances that matter. Recovery threshold tests each function's alignment against two benchmarks: Work Recovery Time (WRT) and Maximum Tolerable Period of Disruption (MTPD). These cutoffs act as boundaries between service continuity and unacceptable degradation. By visualizing the WRT:MTPD ratio, this tool highlights where there's healthy buffer and where the margin is razor-thin. A high ratio flags functions skating dangerously close to tolerance limits, while a low ratio signals a more stable recovery window.
Recovery can't be fully understood without mapping the resources required to deliver it and the resource gaps that currently exist. These details separate theoretical planning from executable strategy. With a clear picture of gaps across functions and categories, decision-makers are better positioned to prioritize investment, rebalance internal capacity, or trigger contingency playbooks with full visibility.
Propose Impact Mitigation
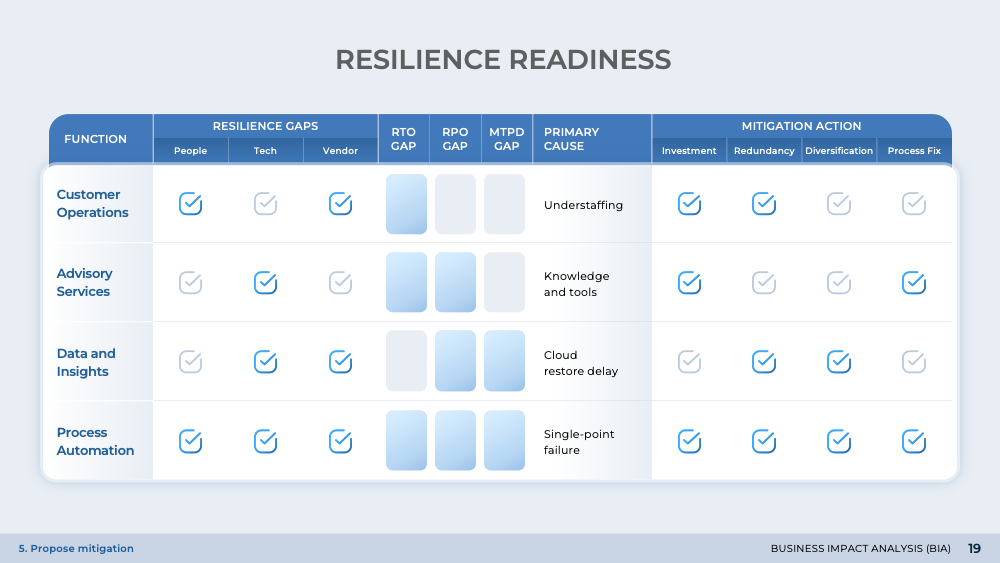
The end of BIA transitions to propose forward-looking mitigation plans. The resilience readiness matrix brings all earlier findings into a single view that links functional gaps, performance shortfalls, and targeted responses. Paired with clearly defined mitigation levers – such as investment, redundancy, diversification, or process fixes – the matrix serves as both diagnostic and prescription.
BIA monitoring closes the loop with an executive-level snapshot of mitigation performance over time. It tracks everything from global risk scores and average RTO/RPO to cumulative potential loss, mapping mitigation effectiveness not just in theory but in operational outcomes. This dashboard serves two key purposes: real-time oversight and long-term trend analysis. In a way, the dashboard is less of a static scorecard and more of a continuous planning tool – one that ensures mitigation doesn't end when the report is filed, but becomes embedded in operational governance.
Conclusion
Business Impact Analysis (BIA) translates vulnerability into visibility and preparedness into process. With a plan of action, teams can maintain composure and won't need to scramble for answers in situations where every minute counts. In volatile environments, BIA is not only an operational safeguard, but also a competitive differentiator built on clarity and control.


