Enter your email address to download and customize presentations for free
How to make sure that your carefully planned AI agenda ultimately delivers its expected values? Our AI Readiness (Part 2) presentation shares a deeper dive into the five key AI readiness levers. With sections that deliver metrics, benchmarks, and decision logic, use this deck to guide your team from unmet readiness gaps to concrete controls that meet desired targets.
Download free weekly presentations
Enter your email address to download and customize presentations for free
Not for commercial use
Download 'AI Readiness (Part 2)' presentation — 24 slides
+39 more presentations per quarter
that's $3 per presentation
/ Quarterly
Commercial use allowed. View other plans


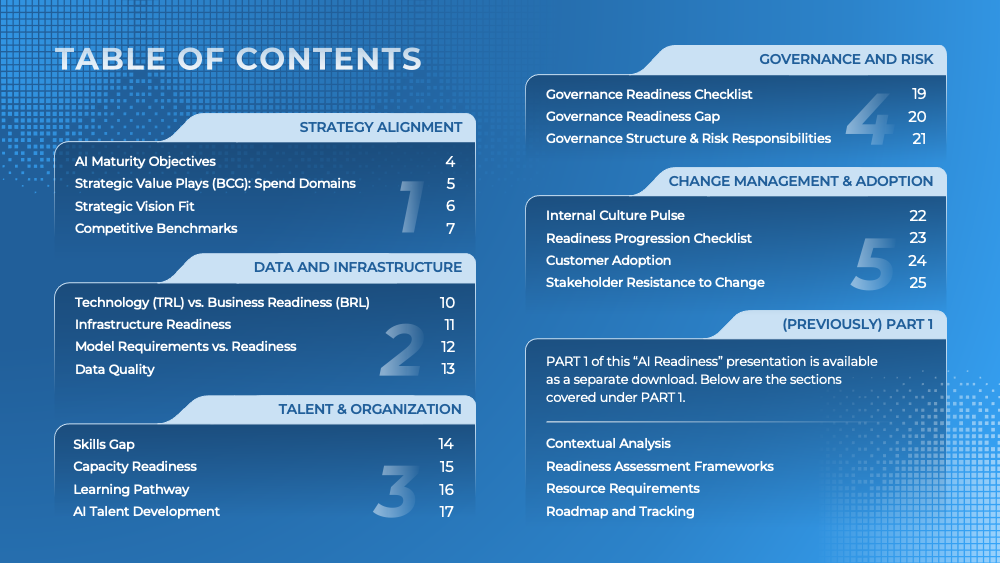


How to make sure that your carefully planned AI agenda ultimately delivers its expected values? Our AI Readiness (Part 2) presentation shares a deeper dive into the five common AI readiness criteria: strategy alignment, data and infrastructure, talent and organization, governance and risk, and change management and adoption. With sections that deliver metrics, benchmarks, and decision logic, use this deck to guide your team from unmet readiness gaps to concrete controls that meet desired targets. With such comprehensive examination, teams can prioritize capital deployment toward the highest-leverage bottlenecks, accelerate time-to-value, and synchronize AI developments with broader enterprise strategies.
As key AI readiness levers are successfully brought closer to maturity, the organization gains the agility to pivot to emerging opportunities, the financial headroom to reinvest, and the reputational equity to attract premier partners and regulatory backing.
Download free weekly presentations
Enter your email address to download and customize presentations for free
Not for commercial use
Download 'AI Readiness (Part 2)' presentation — 24 slides
+39 more presentations per quarter
that's $3 per presentation
/ Quarterly
Commercial use allowed. View other plans
Momentum in AI strategy often falters because leaders debate individual use cases in isolation rather than viewing the entire portfolio through a value-creation lens. The Strategic Value Plays clusters proposed initiatives into the BCG AI Radar domains of Invent, Reshape, and Deploy. It then overlays spend levels and projected lift on readiness. By grounding investment decisions in measurable readiness lift, this analysis guides capital allocation to reinforce, rather than distract from, long-term strategic cohesion.
Where portfolio composition tells one side of the story, Strategic Vision Fit links corporate goals to concrete AI tactics to find common performance targets. As each AI initiative is tethered to a board-level KPI, product owners must articulate contribution in language the CFO, CHRO, and regulators all understand. As a result, only initiatives that raise both readiness and strategic fit earn runway, thus eliminating the scatter-shot innovation budgets that plagued first-wave AI programs.
Competitive pressure often determines the pace at which strategy alignment must advance. The Competitive Benchmarks suite stacks readiness scores against leading industry rivals. Subsequently, Areas to Emulate pinpoints tactics that rivals have executed more successfully and attaches measurable targets as ways to catch up. This framing converts aspiration into a replicable playbook.
But rather than blanket catch-up spending, Areas to Differentiate shifts the lens to spaces where the organization can leapfrog. The juxtaposition between "emulation" and "differentiation" zones clarifies tactful trade-offs and prevents knee-jerk imitation.
AI programs collapse when technical maturity outpaces the organization's ability to commercialize, so the Technology vs. Business Readiness (TRL vs. BRL) matrix helps to expose that disconnect early on. As critical AI workloads are plotted along parallel nine-point scales, the matrix reveals which assets sit in a "gold zone" of pervasive value and which linger in "early" or "mid zones" where prototypes still beg for operational buy-in.
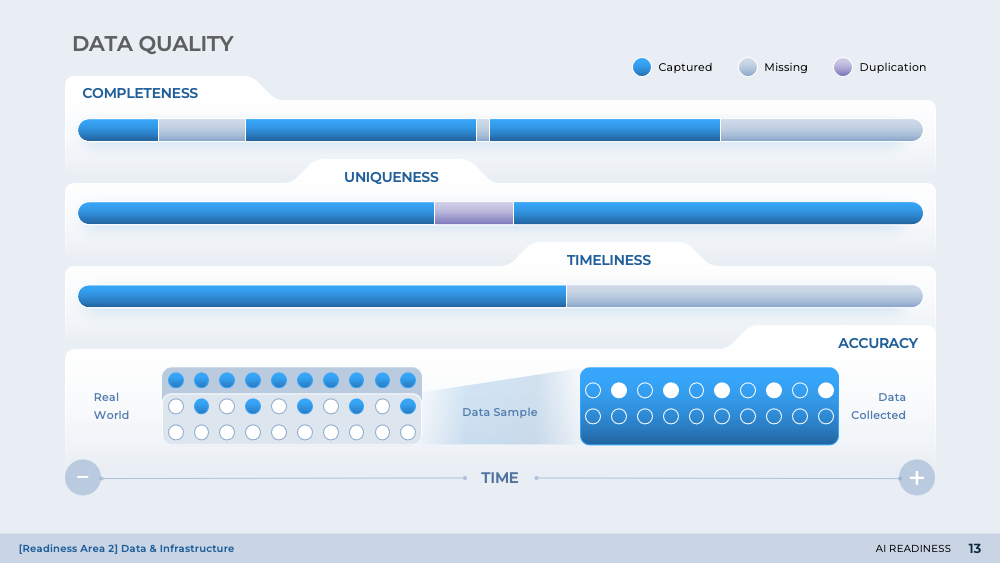
Once maturity misalignments surface, the Infrastructure Readiness Gap radar quantifies how far core platforms must stretch to sustain enterprise AI. Concentric domains (such as data pipeline, storage, API integration, and security and compliance) are split into "present" and "future" rings to show latent deficits. The analysis also creates a single language for diverse stakeholders: compliance officers may care about ISO 42001 coverage, while site-reliability engineers may focus on mean time to detect, yet both metrics live side-by-side to reinforce the notion that infrastructure readiness is a multi-disciplinary pursuit.
Finally, Model Requirements vs. Readiness ties architectural diagnostics to the economic realities of serving models at scale. The table assesses model requirements such as performance, cost, compliance, integration effort, and scalability against disciplined target requirements.
Download free weekly presentations
Enter your email address to download and customize presentations for free
Not for commercial use
Download 'AI Readiness (Part 2)' presentation — 24 slides
+39 more presentations per quarter
that's $3 per presentation
/ Quarterly
Commercial use allowed. View other plans
The Skills Gap matrix maps current versus target competency and availability levels across key AI domains. This in turn exposes talent bottlenecks that technology dashboards routinely overlook. Because the matrix separates "competency" from "availability," it also prevents the classic hiring misstep of chasing headcount when upskilling the available bench would close the gap faster.
After competency gaps are clear, the Capacity Readiness wheel quantifies how much productive horsepower the organization can mobilize without new recruitment. Each concentric dot represents a deployable FTE across key domains. More importantly, the surrounding FTE-gap cards convert that shortfall into a sourcing strategy: how many full-time hires, contractors, or agency partners are needed.
For current employees to master AI skills, the Learning Pathway roadmap sequences skill progression for individual contributors, team leads, and executives over a multi-year horizon. The left-to-right flow demarcates foundational, job-specific, and advanced competencies, while color codes distinguish technical and non-technical skill areas.
Transparent pathways need funding, and the twin AI Talent Development Resources and Outcomes panels make the investment case impossible to ignore. The real persuasion comes from showing each tranche against projected ROI. As the resources panel commits dollars and the outcomes panel commits to measurable business results, together they transform talent development from a hopeful HR initiative into a capitalized growth engine.
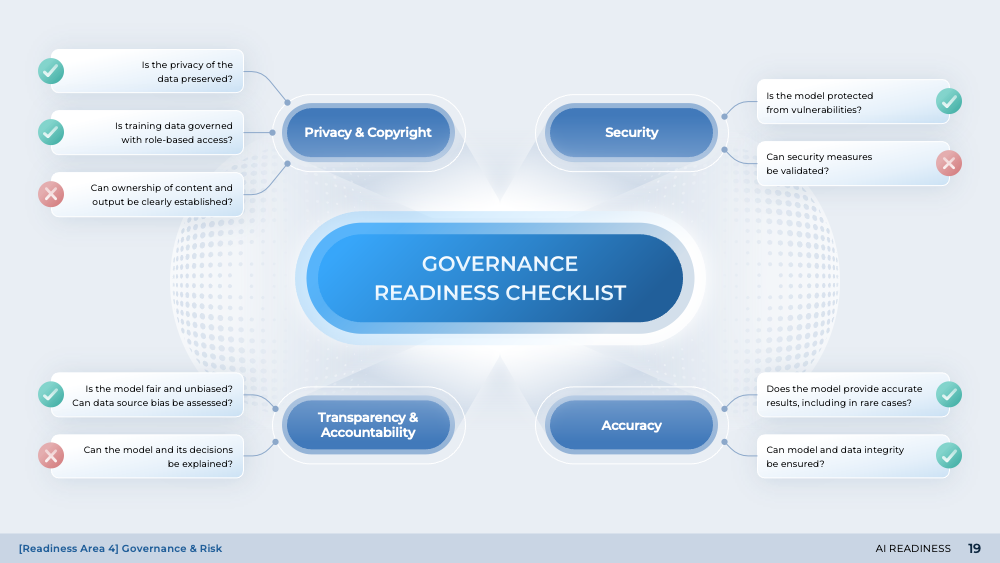
The Governance Readiness Gap converts abstract risk talk into a measurable maturity ladder. Each control domain is marked by the current state across five levels from awareness to innovation. This is then compared next to progress marking for the target levels.
Diagnosis, however, only goes so far without a clear operating model. The Governance Structure & Risk Responsibilities map scatters key stakeholder roles across a matrix of security, accountability, data integrity, and transparency obligations. This layout reveals overlaps and gaps in the current risk apparatus and disarms the "somebody else's problem" mindset.
Internal adoption can falter when employees misjudge AI's impact on their roles. An Internal Culture Pulse surfaces those concerns before they worsen into unshakable resistance. For example, as much as excitement over task automation may add to readiness level, fears of job displacement and performance surveillance erode readiness. Such tension can inspire interventions such as role-redesign or more transparent career pathways.
Stakeholder endorsement determines whether AI pilots graduate to enterprise standards, and the Stakeholder Resistance map translates diffuse anxieties into a crisp influence-agreement matrix. The grid also highlights latent allies whose influence is high but resistance low, making them force multipliers for public‐market messaging or capital raises. Each stakeholder group's main concern is then paired planned response in order to close the loop between external perception and internal velocity.
Customer behavior validates AI investment, and the Customer Adoption chart plots use cases against resistance and opportunity cost. Low-friction features sit in the green zone, ready for scaling, while high-resistance bets hover in red, carrying steeper regulatory and reputational stakes. By embedding customer psychology alongside technical metrics in the same decision frame, the analysis merges market research with agile planning. That way, adoption risk is priced into every go-to-market milestone and AI readiness is ultimately validated where it matters: at the point of customer value capture.
End-to-end AI readiness demands synchronized progress across strategy, infrastructure, talent, governance, and adoption. AI Readiness (Part 2) acts as a playbook that converts abstract aspirations into quantified gaps, sequenced investments, accountable owners, and measurable returns. Teams that apply its logic can de-risk scale, compress learning cycles, and capture AI's economic upside ahead of competitors.
Download free weekly presentations
Enter your email address to download and customize presentations for free
Not for commercial use
Download 'AI Readiness (Part 2)' presentation — 24 slides
+39 more presentations per quarter
that's $3 per presentation
/ Quarterly
Commercial use allowed. View other plans

How to avoid costly false starts when demands for AI usage surge yet organizational readiness lags? Reframe your AI ambitions with our AI Readiness presentation and turn hype into sequenced action with contextual analyses, readiness assessment frameworks developed by industry leaders, resource allocation requirements, and long-term roadmaps.

How to watch out for the pitfalls of AI applications as they scale to the enterprise level? Our AI Risk Management presentation proposes a disciplined governance loop that begins with precise risk identification, organizes hazards through risk categorization, quantifies exposure via rigorous risk assessment, directs prioritized risk mitigation, and embeds continuous performance tracking and monitoring. Together, these risk management considerations prevent costly operational disruptions, strengthen regulatory confidence, and endure hard-won trust from stakeholders.

Need to identify the optimal AI application areas to boost your internal operations? Our AI Use Cases presentation structures the decision to apply AI around its benefits, associated costs, ROI analysis, use case prioritization, model and data, risk considerations, and implementation. With well-developed AI use cases, teams can automate time-consuming work to free up critical talent for more strategically valuable tasks, augment output capabilities, and achieve scalable performance improvements.

Need a way to transform scattered AI experiments into real business value? Our AI Balanced Scorecard collection includes a suite of layouts to maximize the effectiveness of BSC designs. Use these visualizations to turn your AI ambition into quantified commitments, clarify cause‑effect linkages, and assign capital to the highest‑impact use cases.