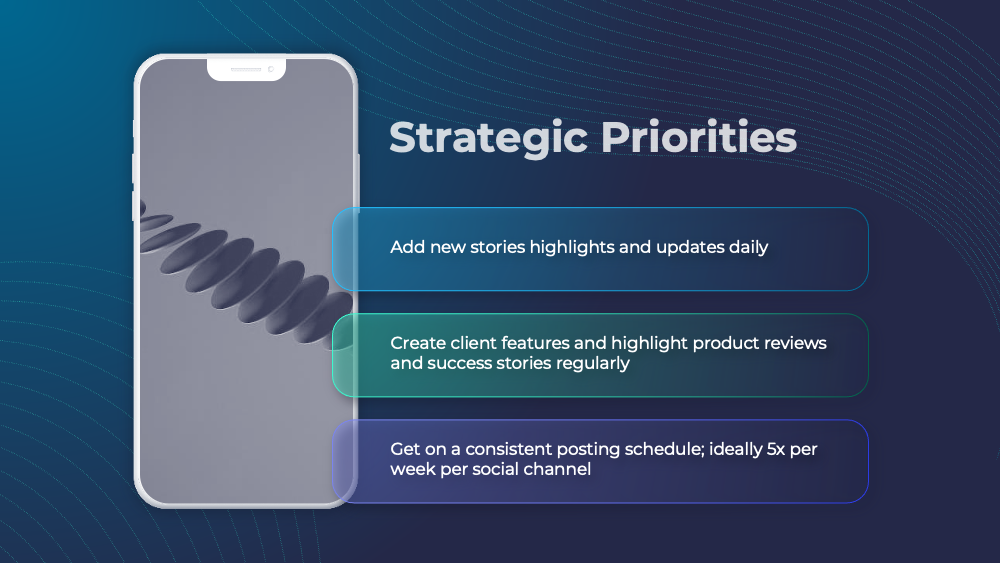
resource preview
resource preview
resource preview
resource preview
resource preview
resource preview
resource preview
resource preview
resource preview
resource preview
resource preview
resource preview
resource preview
resource preview
resource preview
resource preview
resource preview
resource preview
resource preview
resource preview
resource preview
resource preview
resource preview
resource preview
resource preview
resource preview
resource preview
resource preview
resource preview
resource preview
resource preview
resource preview
resource preview
resource preview
resource preview
resource preview
resource preview
chevron_right
chevron_left
download Download this presentation

Download and customize 500+ business templates and translate PowerPoints

Go to dashboard to download stunning resources

Download

Explainer

Preview

View all chevron_right

Synopsis

Need to make social media platforms generate better business values? Our Social Media Report provides customizable slides traffic analysis, audience engagement and growth, social performance check-in, top posts analysis, plus many more. Use these slides to inspire new ideas to a company's overall business strategies.

Traffic analysis

Social media analytics help you create performance reports that can be shared between teams or with any stakeholders. They help companies figure out what works and what doesn't, when it comes to a social media strategy. This slide analyzes where visitors to your web page come from, which pages they go to, and where they interact the most. Those three important metrics are laid out in a Sankey diagram that flows from left to right. It's a useful tool to pinpoint your weak spots. For example, if there aren't many visitors from Yelp or Twitter, it might not be worth it for your business to keep posting there. On the other hand, if a certain page on your site gets a lot of traffic, it's a good idea to invest more time and energy into making it the best page possible. (Slide 10)

stars icon
Questions and answers
info icon

One example of a company that successfully used social media analytics to boost their online presence and business performance is Starbucks. Starbucks has a strong social media presence and they use social media analytics to understand customer preferences, sentiment towards their brand, and the effectiveness of their marketing campaigns. They analyze data from various social media platforms to understand where their customers are most active and what type of content resonates with them. This data-driven approach has helped Starbucks to tailor their marketing efforts, resulting in increased customer engagement and sales.

Some alternative methods to the Sankey diagram for analyzing web page traffic and user interaction include the use of heat maps, click maps, scroll maps, and funnel analysis. Heat maps show where users have clicked on a page, or how far they have scrolled, giving a visual representation of user interaction. Click maps specifically show where the most common clicks occur. Scroll maps indicate how far down a page users typically scroll, which can be useful for understanding if important content is being seen. Funnel analysis is another useful tool, which shows the conversion rates between different steps of a user journey, such as from landing on a site, to adding a product to a cart, to completing a purchase.

View all questions
stars icon Ask follow up
resource image

Engagement by time

Every marketer that posts on social media wants to know the best time to post content for maximum engagement. On this heat map, viewers can tell by the differences in color saturation which times of the day have the most visitors. It's good to know what times users typically assign to your brand, so marketers and creators can base upload times around those. The heat map can be used for engagement with a specific platform or even a specific type of post. (Slide 11)

stars icon
Questions and answers
info icon

While the content does not provide a specific case study, it is known that many companies use heat maps to optimize their social media engagement. Heat maps can show when users are most active on their platforms, allowing them to post at peak times for maximum visibility. For example, a company might notice that their audience is most active between 6-8 PM, so they schedule their posts for that time to increase engagement. However, without specific examples in the content, it's difficult to provide a real-world case study.

Some alternative strategies to using heat maps for determining the best times to post on social media include:

1. Using analytics tools: Most social media platforms provide analytics tools that can help you understand when your audience is most active.

2. Experimentation: You can experiment by posting at different times and days and then analyzing the engagement each post receives.

3. Competitor analysis: Look at when your competitors are posting and the engagement they are receiving.

4. Surveys: Ask your audience directly when they are most likely to engage with your content.

5. Use of third-party tools: There are several third-party tools available that analyze your social media data and suggest the best times to post.

View all questions
stars icon Ask follow up
resource image

Every brand is unique, so it's best to find out early what the peak times are to help build a strategy. The best times to post depend on a variety of factors, and there's no one-size-fits-all approach. For example, studies show the best times for tech brands like Apple or Sony to post are Monday and Tuesday mornings, while CPG companies like Red Bull or Nestle get the most engagement mid-day Thursday and Friday. 

stars icon
Questions and answers
info icon

Predicting future trends in social media engagement for tech brands like Google or Sony is challenging due to the dynamic nature of social media and the tech industry. However, one can make educated guesses based on current trends, historical data, and industry insights. For instance, we can expect a continued focus on personalized content, increased use of video and live streaming, and further integration of AI and machine learning in social media strategies. It's also likely that tech brands will continue to leverage social media for customer service and engagement, given the direct access to consumers these platforms provide. Please note that these are general trends and the actual engagement strategies may vary for each brand based on their specific goals and target audience.

Companies like Nvidia or Tesla could use several strategies to increase audience engagement on social media. They could host interactive live sessions or webinars on trending topics related to their industry. They could also run contests or giveaways that encourage users to share their posts or use their branded hashtags. User-generated content is another effective strategy; they could feature customer reviews or stories, or repost user photos of their products. Regularly updating their social media with behind-the-scenes content, industry news, or sneak peeks of upcoming products can also keep their audience engaged and looking forward to their posts.

View all questions
stars icon Ask follow up

Audience growth

resource image

If everything goes according to plan, your audience and follower count should grow steadily over time. This slide shows the total follower count and the growth rate in a given period. It provides a snapshot look at the numbers that matter. This is especially useful for when a company is still in the earlier stage to build an online presence and needs to prove continuous growth over a few months. It can also be used to show audience growth during a giveaway or a similar outreach event, which usually lead to visible growth spikes. Remember, social media reports should be easy to follow, especially for decision makers. Don't go overboard with formatting and let the most important data tell the story. (Slide 13)

stars icon
Questions and answers
info icon

One example of a company that successfully used a giveaway to boost their follower count on social media is the fashion brand, Revolve. They regularly host giveaways on their Instagram account, offering followers the chance to win free clothing items. This strategy has helped them to significantly increase their follower count, as users are required to follow their account, like the giveaway post, and tag a friend in the comments to enter. This not only increases their follower count but also boosts engagement on their posts, leading to further visibility on the platform.

There are several strategies to increase audience growth on social media platforms. One effective method is to consistently produce high-quality content that resonates with your target audience. This could be informative, entertaining, or inspiring content. Another strategy is to engage with your audience by responding to comments, asking for feedback, and encouraging user-generated content. You can also leverage influencers in your industry to reach a wider audience. Running contests or giveaways is another effective way to boost audience growth. Lastly, using social media advertising can help you reach a larger and more targeted audience.

View all questions
stars icon Ask follow up
resource image

This dashboard slide highlights, including engagement rate, total number of sessions, and audience growth. Use it to measure progress and benchmark against periodic goals. The percentages show progress relative to goals. (Slide 14)

resource image

This dashboard separates web traffic by whether it comes from paid or organic sources. Ideally, an effective social media strategy should lead to more and more organic or even viral growth over time. (Slide 15)

stars icon
Questions and answers
info icon

Having a higher percentage of web traffic coming from paid sources compared to organic sources in a social media strategy can have several implications. Firstly, it may indicate that the brand or business is investing significantly in paid promotions or advertisements to drive traffic. While this can lead to immediate results in terms of increased traffic, it may not be sustainable in the long run as it requires continuous investment. Secondly, it may suggest that the brand's organic growth strategies may not be as effective, as they are not driving as much traffic as the paid strategies. This could be a sign that the brand needs to improve its organic growth strategies, such as SEO, content marketing, and social media engagement. Lastly, a higher percentage of paid traffic could potentially lead to a lower return on investment (ROI) compared to organic traffic, as paid traffic often costs more and may not result in as high a level of engagement or conversion.

There are several strategies to increase organic growth over time in social media. First, consistently creating and sharing high-quality, relevant content can attract and engage your audience. Second, using SEO strategies, such as using relevant keywords and hashtags, can help your content get discovered. Third, engaging with your audience by responding to comments and messages can build relationships and encourage them to share your content. Fourth, collaborating with influencers or other businesses can expand your reach. Lastly, running contests or giveaways can increase engagement and visibility.

View all questions
stars icon Ask follow up

Top posts

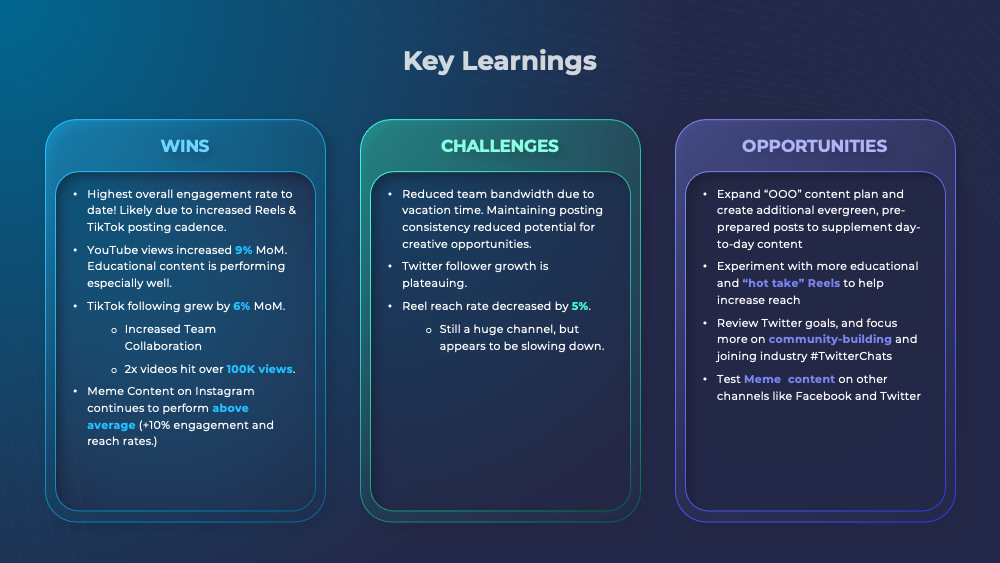
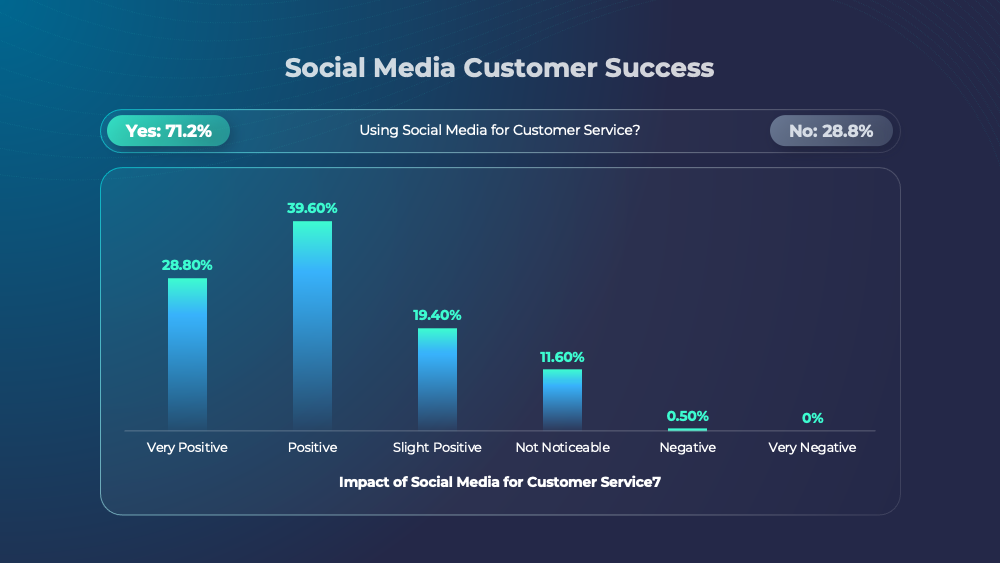
Marketers and strategists rely on a variety of engagement metrics like these to figure out which posts are the top performers. Here we can show the top posts against metrics like interaction or "email open rates". This way you can see what posts or tools get the most engagement, what features work, and draw patterns and insights from the commonalities across these successful examples. With that, it could be a good bet to replicate what works for even more audience growth. (Slide 27)

stars icon
Questions and answers
info icon

While it's not possible to predict future trends with absolute certainty, analyzing successful examples of social media posts can provide valuable insights. By studying the commonalities across top-performing posts, such as the type of content, posting time, and engagement tactics used, marketers can identify patterns and trends. These insights can then be used to inform future social media strategies and potentially drive audience growth. However, it's important to remember that social media trends can change rapidly, and what works today may not necessarily work tomorrow.

Alternative methods to using engagement metrics for determining top performing posts on social media could include analyzing the quality of comments, tracking the number of shares, or measuring the increase in followers after a post. You could also consider the reach of a post, the traffic it drives to your website, or the number of conversions it leads to. Additionally, sentiment analysis can provide insights into how your audience perceives your content. It's also beneficial to look at the overall trends and patterns in your successful posts to replicate what works for even more audience growth.

View all questions
stars icon Ask follow up
resource image
resource image

This slides zooms in on one high-performing post. This way you can show off the best content to stakeholders or your marketing team. In the middle template image, you can change the image to the content of the post, or easily embed a video on powerpoint. You can also hyperlink the template section to the social media post itself, so that when it's clicked, the actual post will display. (Slide 29)

stars icon
Questions and answers
info icon

Hyperlinking the template section to the actual social media post can have several potential implications for audience engagement and growth. Firstly, it can increase user interaction as it provides a direct link to the content, making it easier for the audience to access and engage with it. This can lead to increased likes, shares, and comments, which can boost the post's visibility and reach. Secondly, it can provide a more seamless user experience, as users won't have to leave the platform to view the content. This can lead to longer session durations and lower bounce rates. Lastly, it can provide valuable data on user behavior, which can be used to optimize future content and targeting strategies.

There are several alternative methods to showcase the best content to stakeholders apart from embedding videos or images in a PowerPoint presentation. One method is to create an interactive dashboard using tools like Tableau or Google Data Studio. These dashboards can include charts, graphs, and other visualizations that can be updated in real-time. Another method is to use a digital portfolio or website to showcase the content. This can include blog posts, case studies, and other written content. You can also use social media platforms to share the content and engage with stakeholders. Additionally, you can create a PDF report that includes detailed analysis and commentary on the content.

View all questions
stars icon Ask follow up
resource image

Competitive benchmarking is used to measure your company's social media campaigns against other players in the industry. When you know how the competition is doing, it can help set more actionable, realistic goals. This table maps out the competition in four distinct zones. The Leaders experience the highest growth rate and get the most traffic, while niche players have the most room to grow. (Slide 32)

stars icon
Questions and answers
info icon

In the context of competitive benchmarking in social media, 'Leaders' are those who experience the highest growth rate and get the most traffic. They are the top performers in the industry and set the benchmark for success. On the other hand, 'Niche Players' are those who have the most room to grow. They may not have the highest traffic or growth rate, but they have potential for improvement and can often target specific, niche markets effectively.

The Social Media Report can inspire new ideas for a company's overall business strategies in several ways. Firstly, it provides insights into audience engagement and growth, which can help in identifying potential areas for expansion or improvement. Secondly, it offers a competitive benchmarking feature that allows companies to compare their social media campaigns with those of their competitors. This can inspire new strategies by highlighting areas where the competition is outperforming and identifying opportunities for differentiation. Lastly, the report's analysis of top posts can provide inspiration for content creation, helping to drive more traffic and engagement.

View all questions
stars icon Ask follow up

Conclusion

As always, feel free to mix and match the tools that work best for your intended audience and reporting needs. Uncover new ways to visualize processes, organize teams, improve existing workflows, and envision new ways of doing things with this Social Media Report presentation.

download Download this presentation

Download and customize 500+ business templates and translate PowerPoints

Go to dashboard to download stunning resources

Download